Abstract
Processing 3D point cloud data presents challenges, such as dealing with unstructured and noisy datasets. Semantic segmentation assigns labels to points based on geometric features. Incorporating geometric features into point cloud segmentation techniques improves performance, but selecting effective characteristics requires high processing power.
This study focuses on using geometric features for point cloud semantic segmentation and applying SHapley Additive exPlanations (SHAP) — an Explainable Artificial Intelligence (XAI) technique. A 0.5 meter local neighborhood radius was defined to extract 8 geometric features (Linearity, Planarity, Sphericity, Omnivariance, Anisotropy, Eigenentropy, Sum of λs, Change of curvature) alongside Height (Z), roughness, mean curvature, gaussian curvature, verticality, intensity, normal change rate, number of returns, and volume density.
Machine learning models — XGBoost, LightGBM, and CatBoost — were employed. Global and Local SHAP interpretations assessed the model behavior and feature effectiveness.
I. Introduction
Semantic segmentation of 3D point clouds is required to interpret 3D data in object detection. Recently, machine learning algorithms are commonly employed for these tasks. However, these classifiers have a black-box structure, meaning their decision processes are unknown to the operator.
Explainable Artificial Intelligence (XAI) techniques provide insights into the decision-making process of AI models. XAI helps determine what features or variables the model thinks are most significant when making predictions. In semantic segmentation, a proper neighborhood definition is a necessary precondition for the extraction of geometric characteristics. This study interests in the efficiency of geometric features in point cloud semantic segmentation with XAI by finding spatial relationships with neighborhood points.
II. Related Work
Point cloud segmentation methods perform better when geometric elements are included. Thus, there is a growing need in the interpretation of geometric features. XAI techniques better describe transparency, the behavior of the model, and the black-box part inside it. Pointhop was one of the first XAIs used for point cloud classification. While there are studies researching the global analysis of geometric features in point cloud semantic segmentation using XAI, there are very limited studies researching local analysis by implementing XAI methods.
III. Dataset and Materials
Dataset
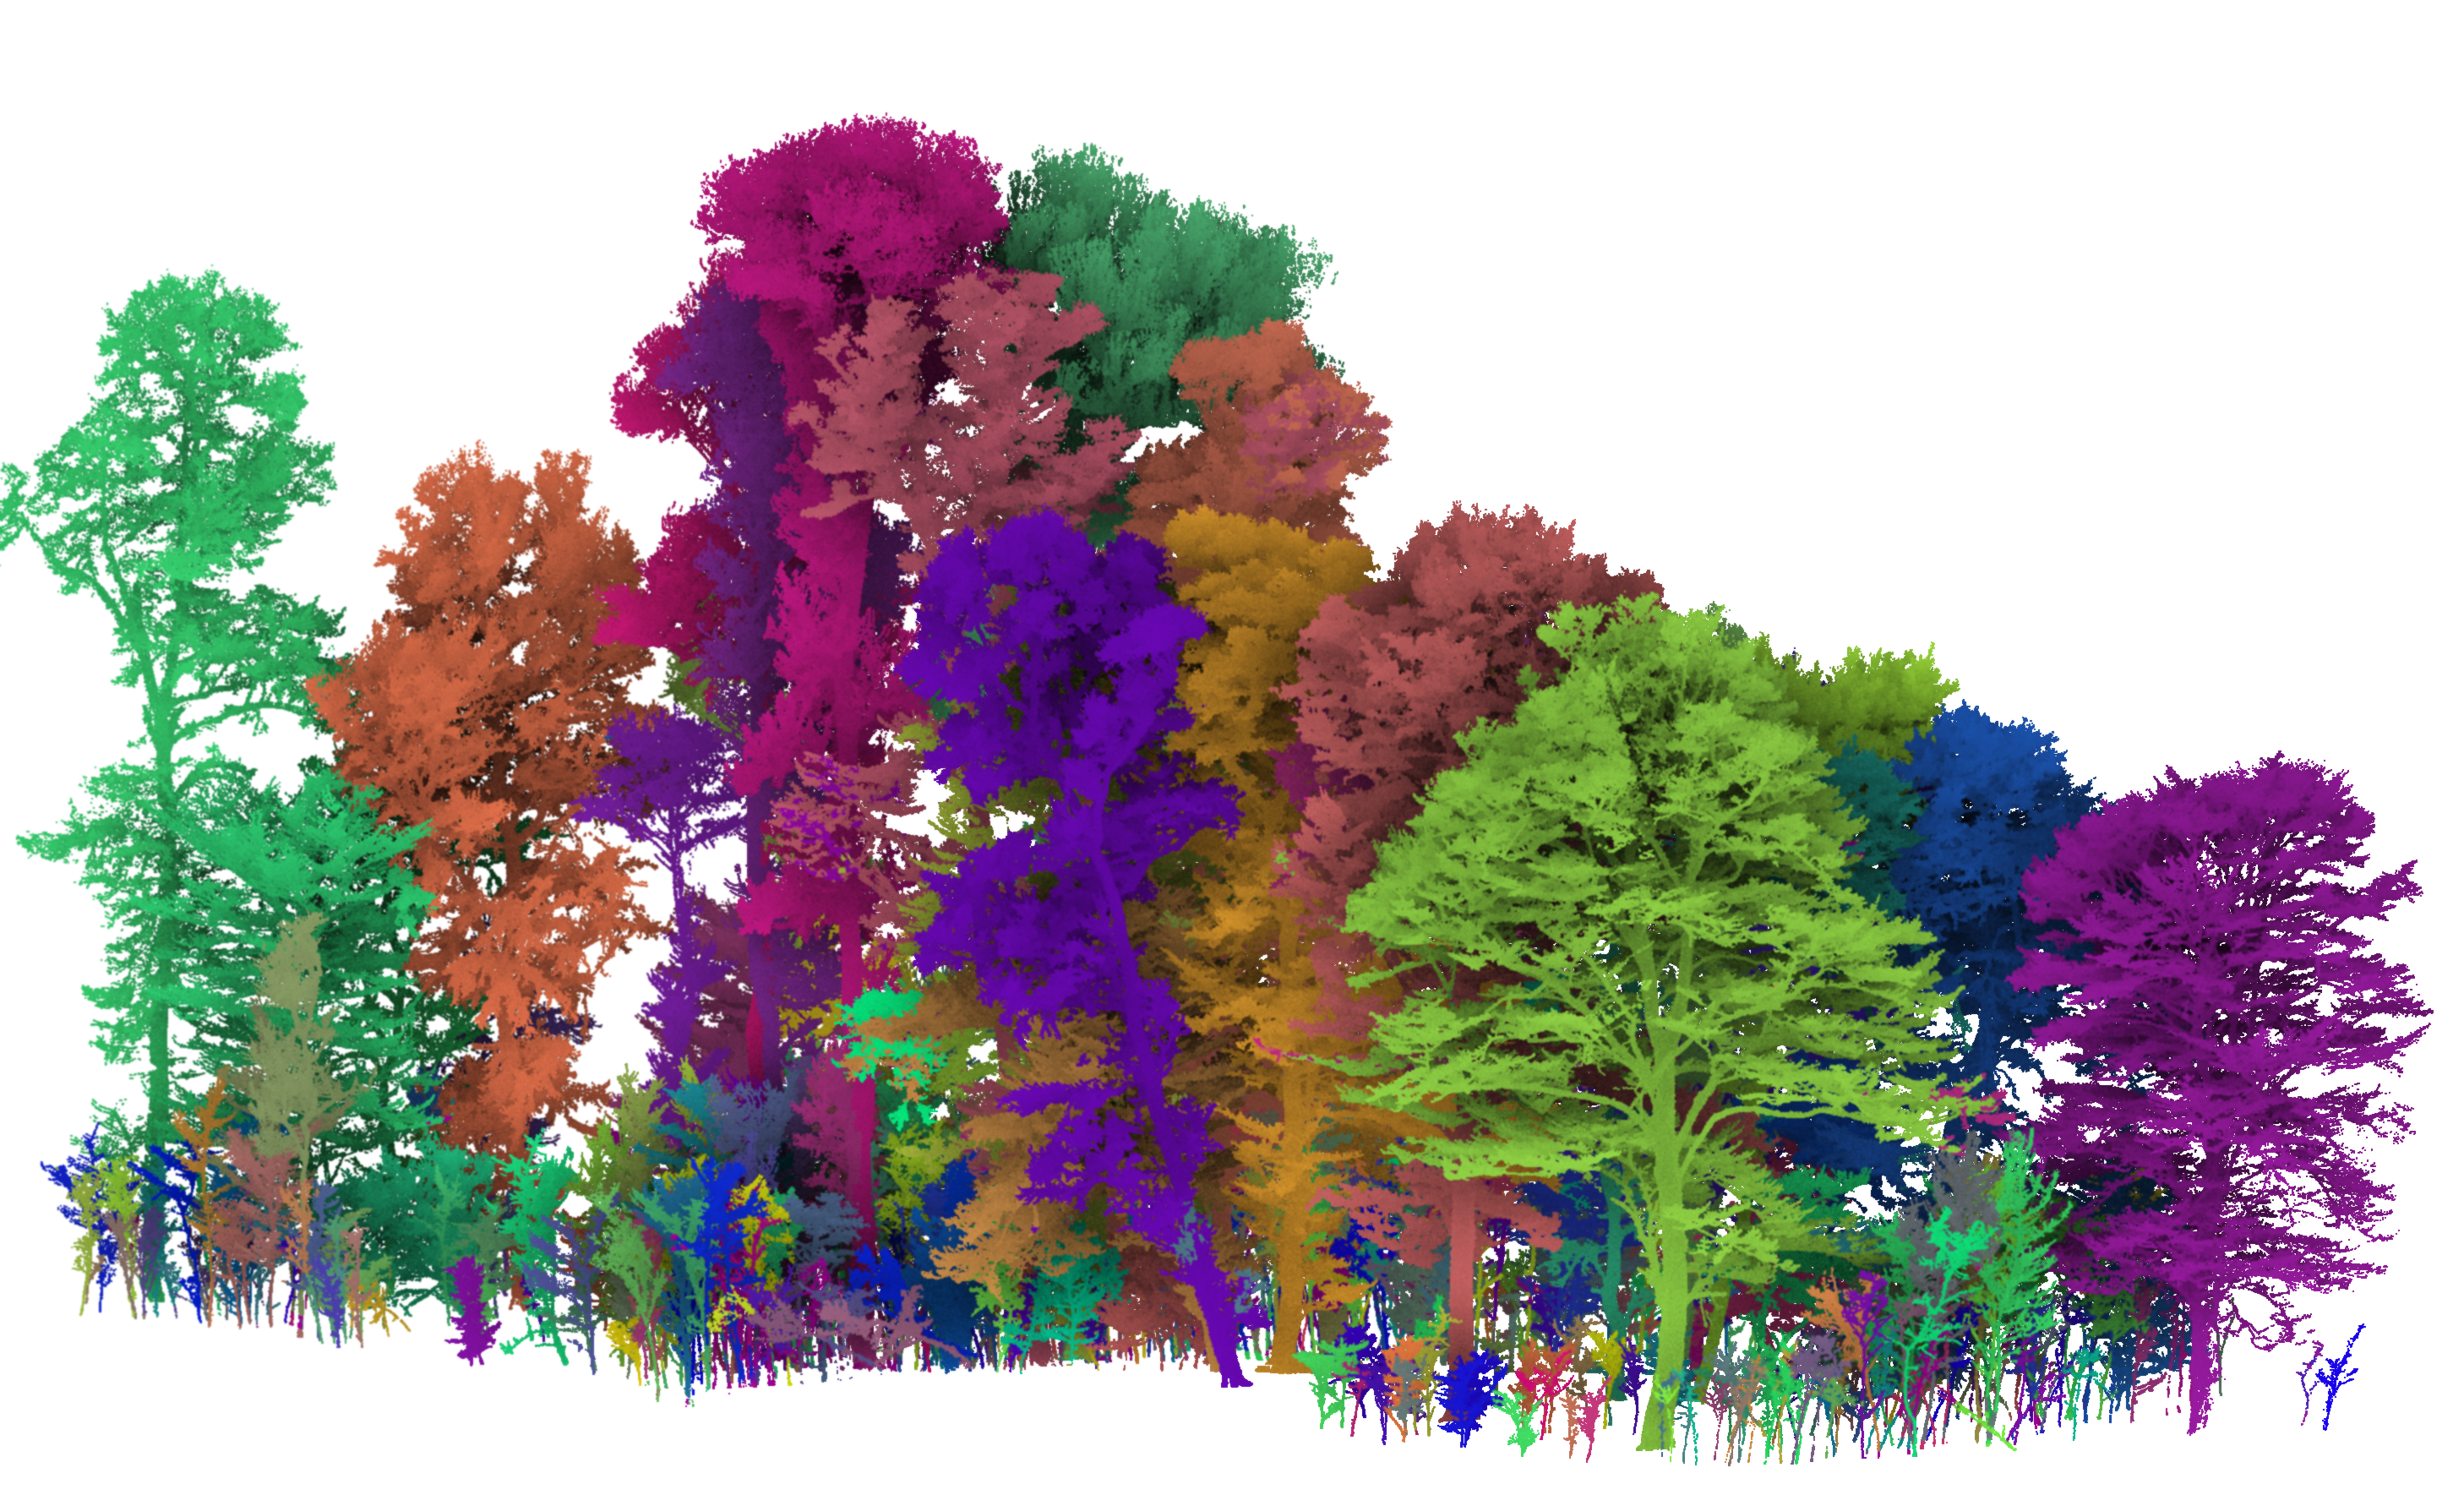
The FOR-instance dataset, a benchmark dataset created for semantic and instance segmentation of individual trees from dense aerial laser scanning data, was used. It consists of five UAV-based laser scanning data collections representing different forest kinds (Norway, Czech Republic, Austria, New Zealand, Australia). The RMIT collection from Australia was used in this study.
Geometric Features
It is necessary to compute geometric features like covariance and local plane features from a specific local neighborhood surrounding each point. The local neighborhood distance was selected as 0.5 m. The calculated geometric features include:
- Local Neighborhood Features (0.5m radius): Linearity, Planarity, Sphericity, Omnivariance, Anisotropy, Eigenentropy, Surface Variation, Verticality, Roughness, Normal Change Rate, and Volume Density.
- Spatial & Spectral Features: 3D Coordinates (X, Y, Z) and Color (Red, Green, Blue).
- LiDAR Attributes: Intensity, Return Number, Number of Returns, and Scan Angle Rank.
Machine Learning Classifiers and SHAP
The machine learning techniques were implemented using the Scikit-Learn library:
- XGBoost: A scalable tree boosting method providing state-of-the-art results.
- LightGBM: A highly efficient gradient boosting framework designed to be quick and scalable, speeding up the training process by up to 20 times over standard GBDT.
- CatBoost: Uses ordered boosting (a permutation-driven substitute for the traditional approach) and a novel technique for handling categorical features.
SHAP (SHapley Additive exPlanations): An XAI method based on cooperative game theory that provides each feature an importance score representing how much of an impact it has on the model's output.
IV. Results
Classified Points for the Dataset
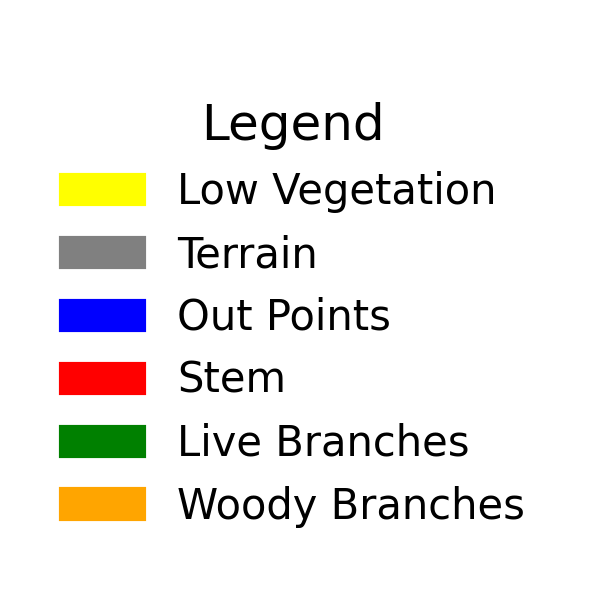
The optimized models achieved highly robust baseline metrics across 6 highly-imbalanced semantic classes. XGBoost reached ~0.82 Accuracy and ~0.80 Macro F1. LightGBM and CatBoost performed similarly with ~0.81 Accuracy and ~0.80 Macro F1 scores, demonstrating consistent performance across different boosting implementations.
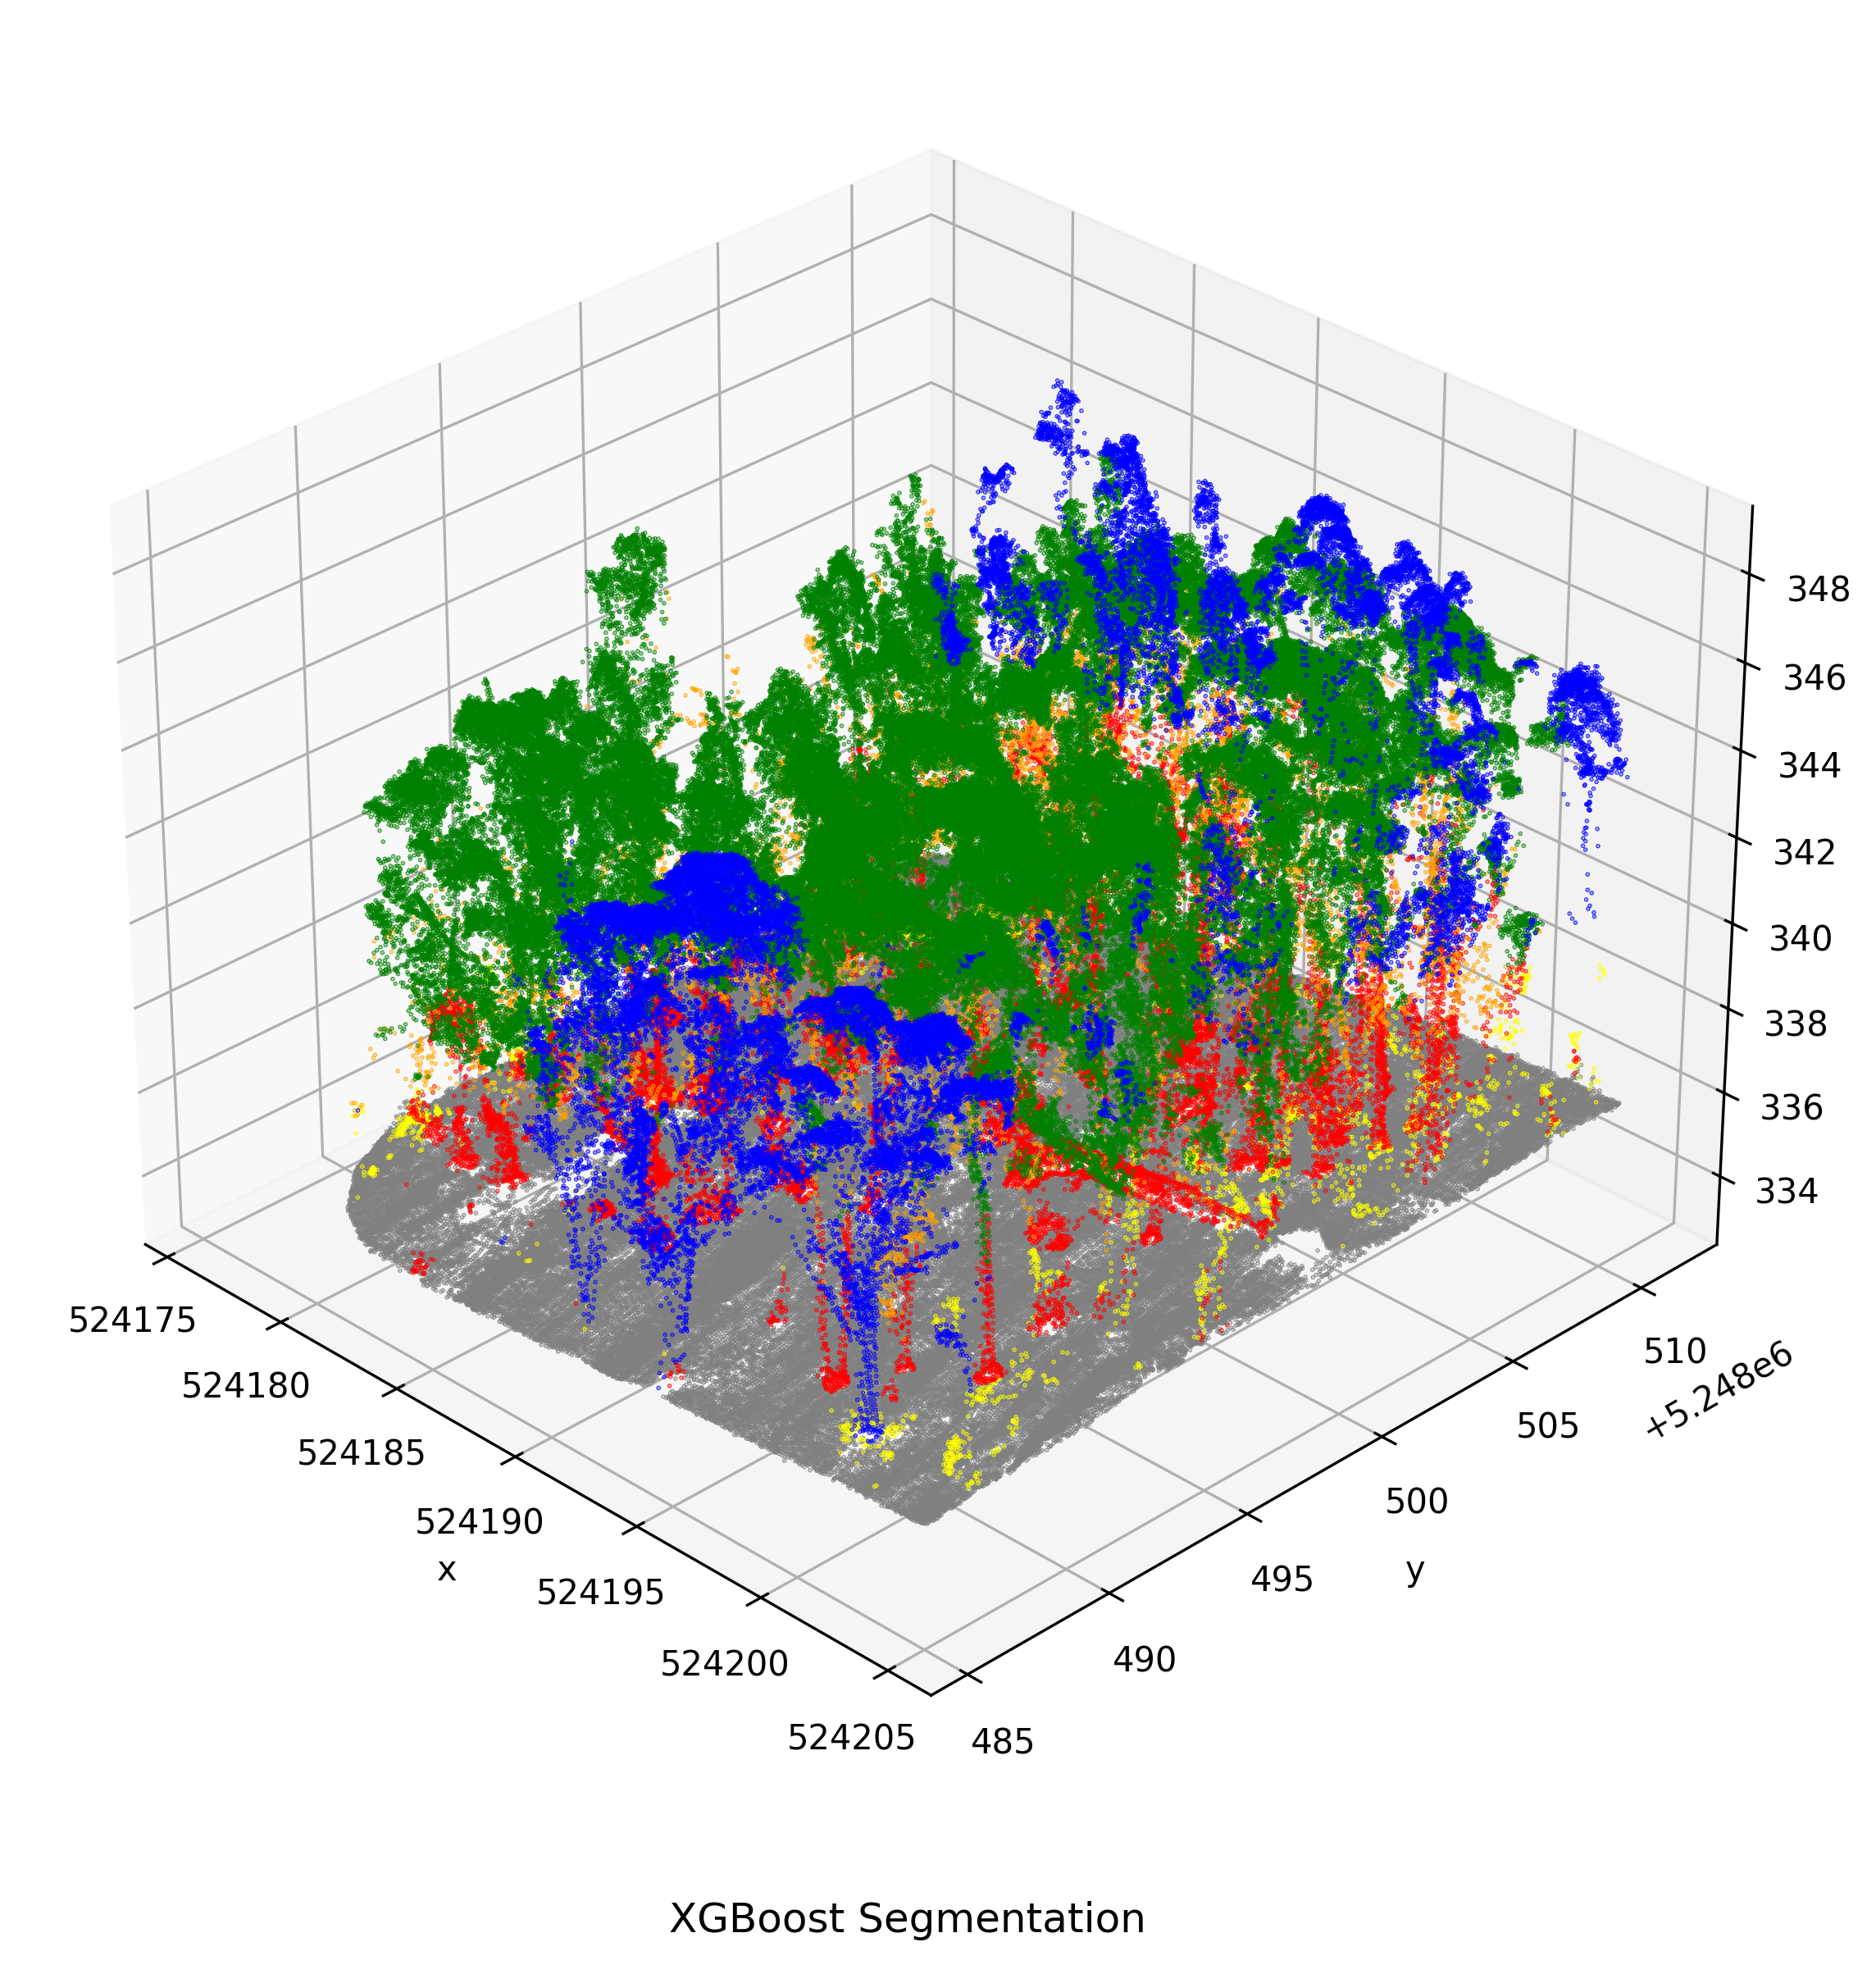
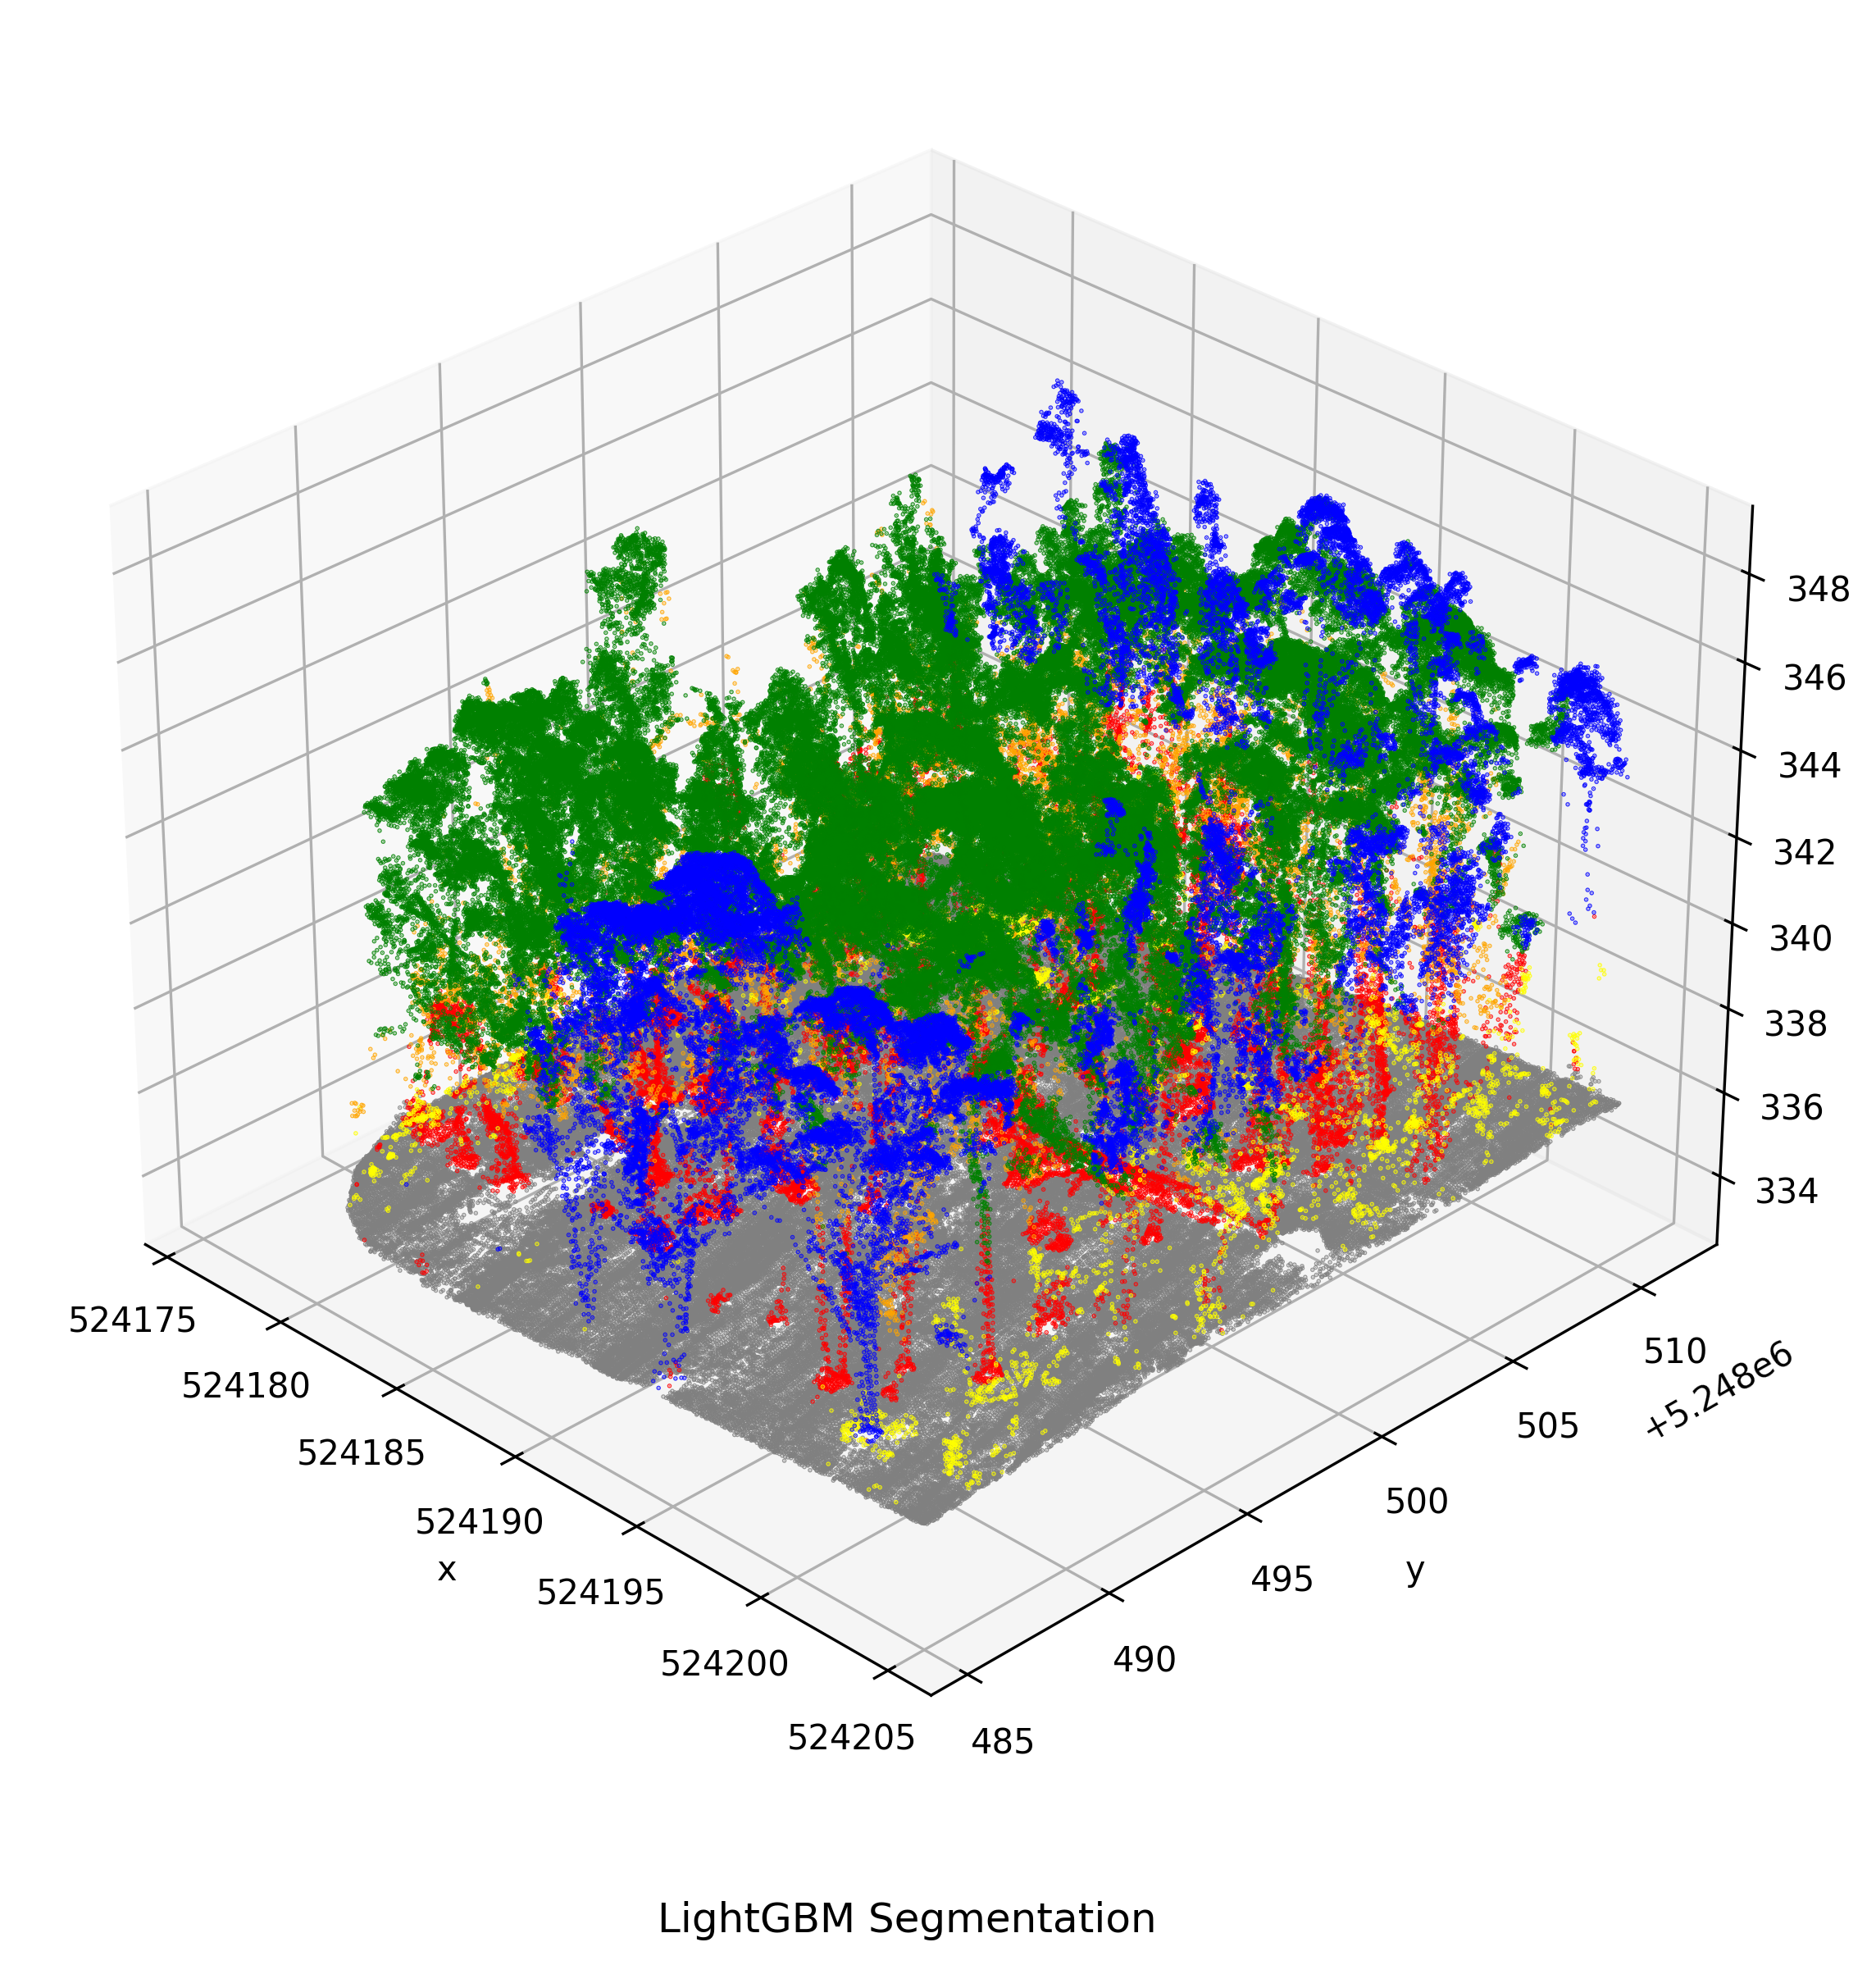
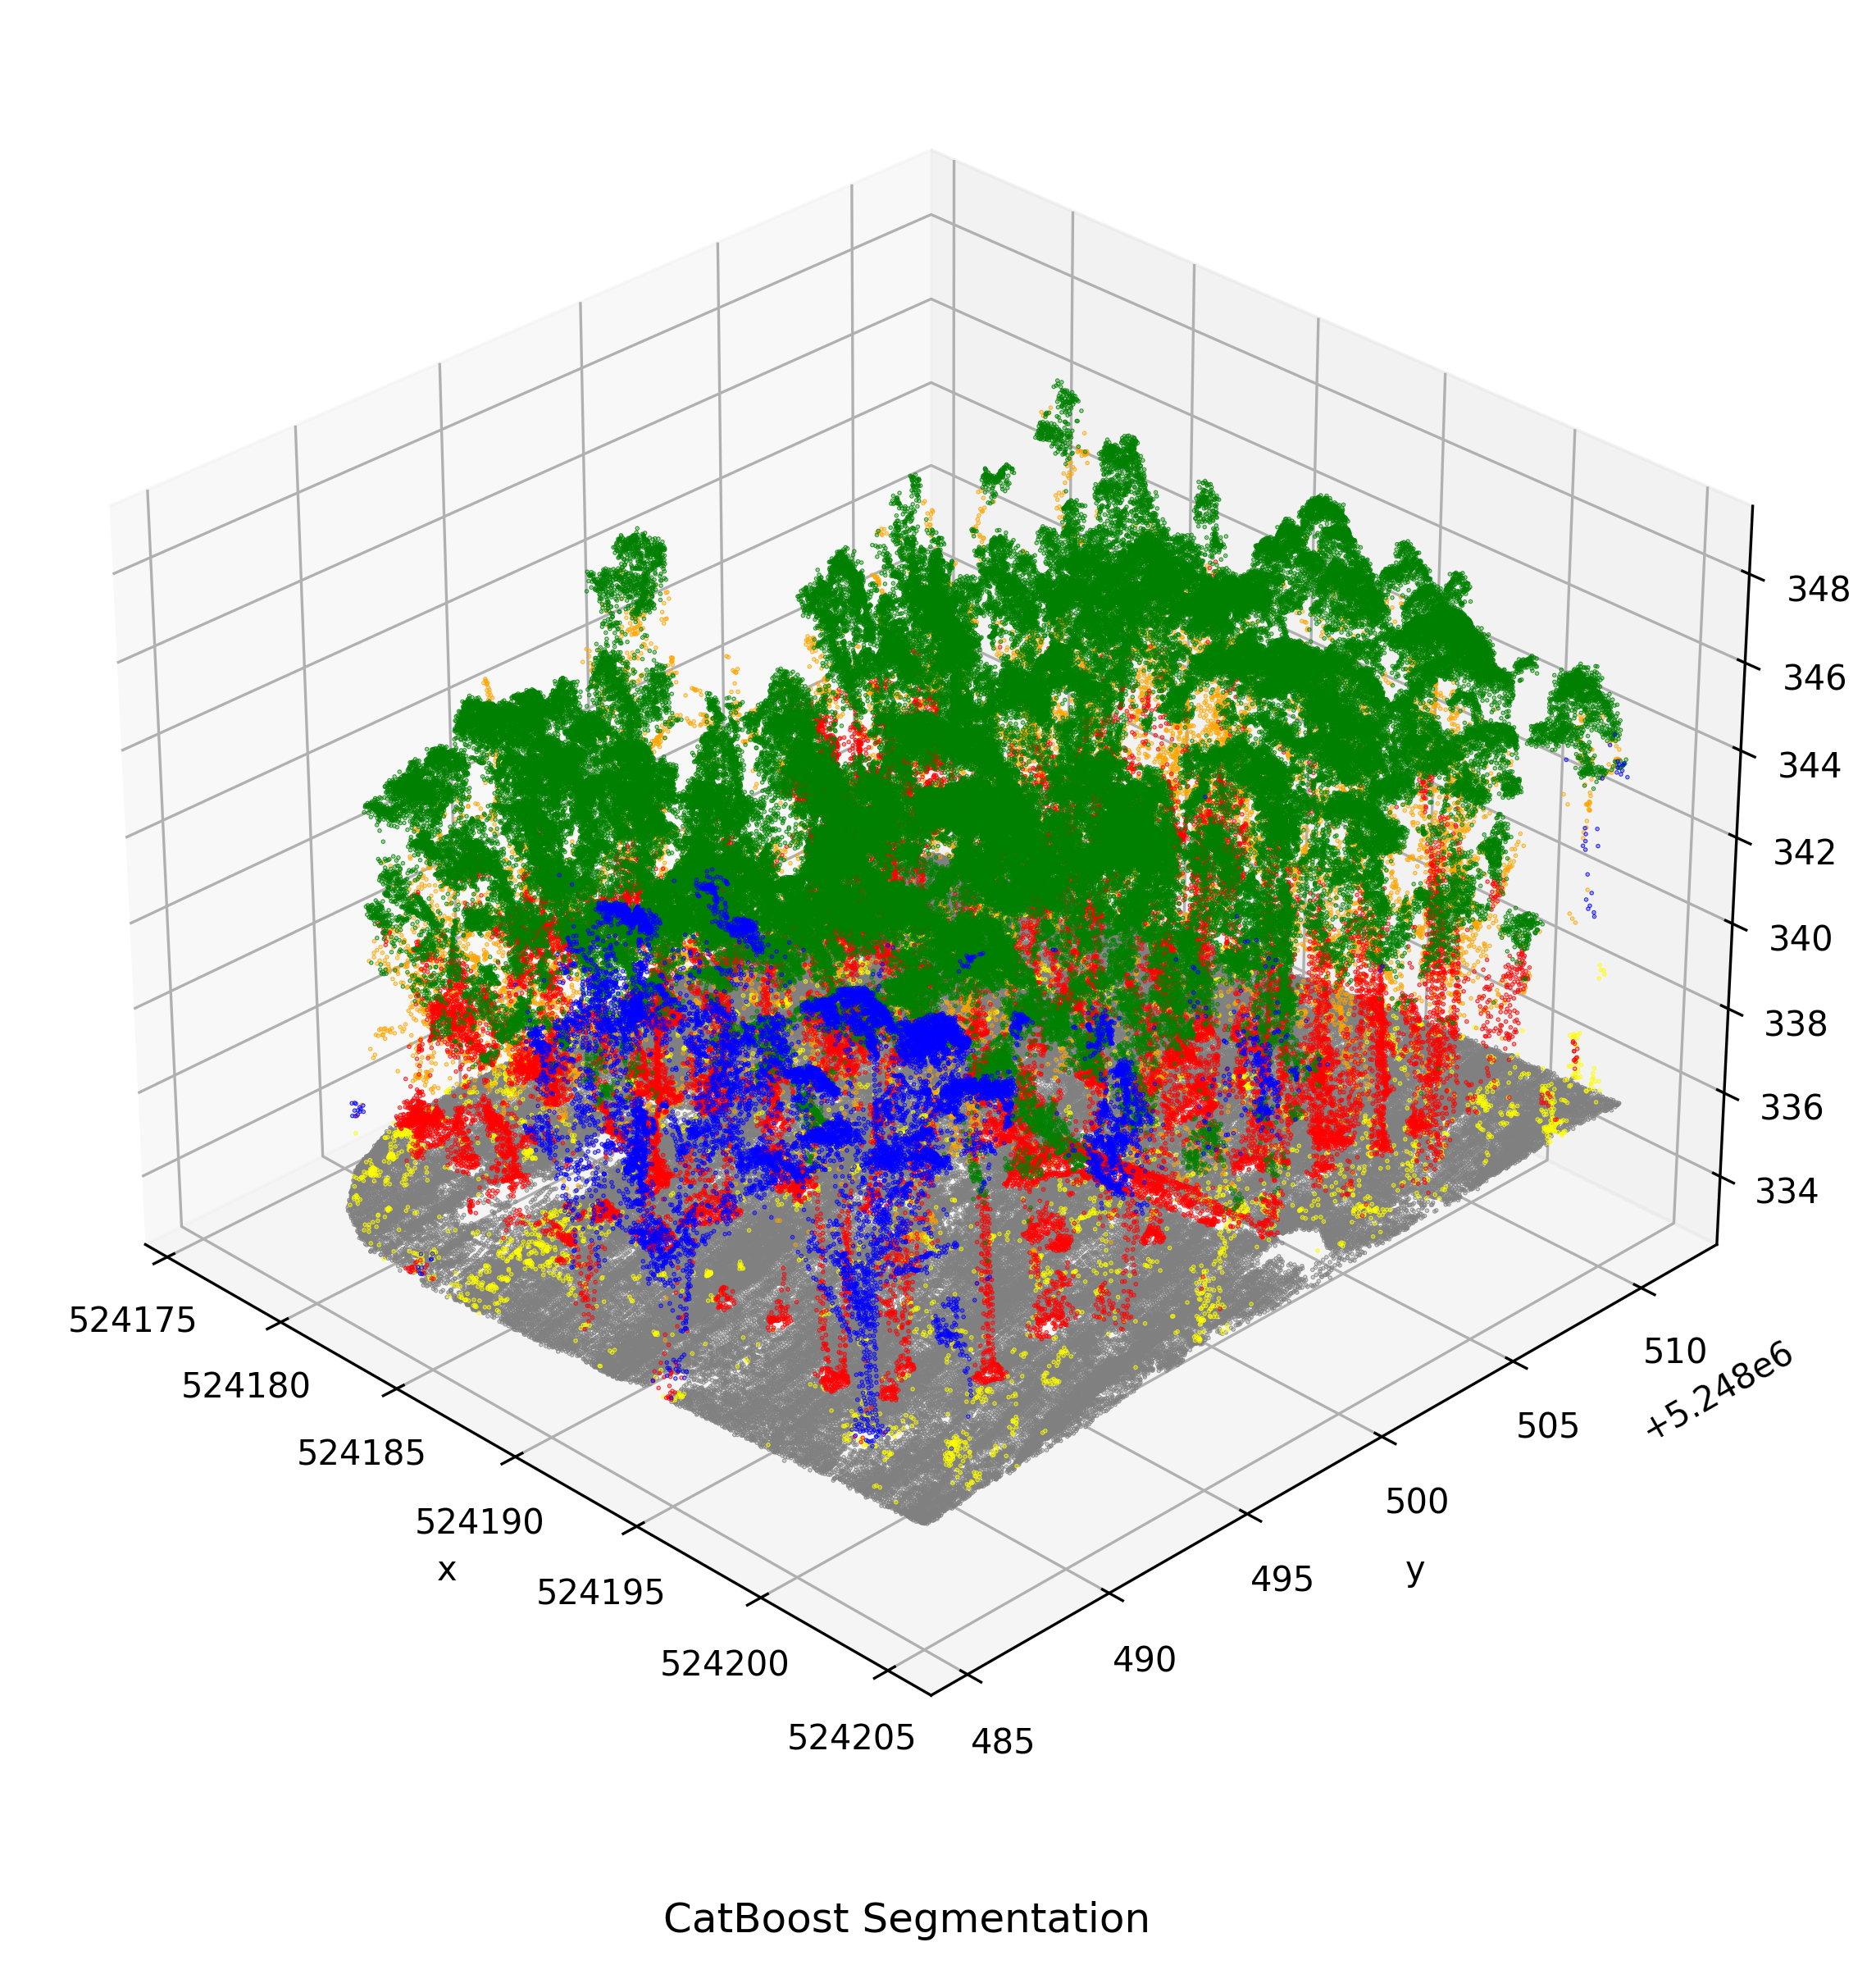
SHAP Analysis Model Interpretation
1. Global Interpretation
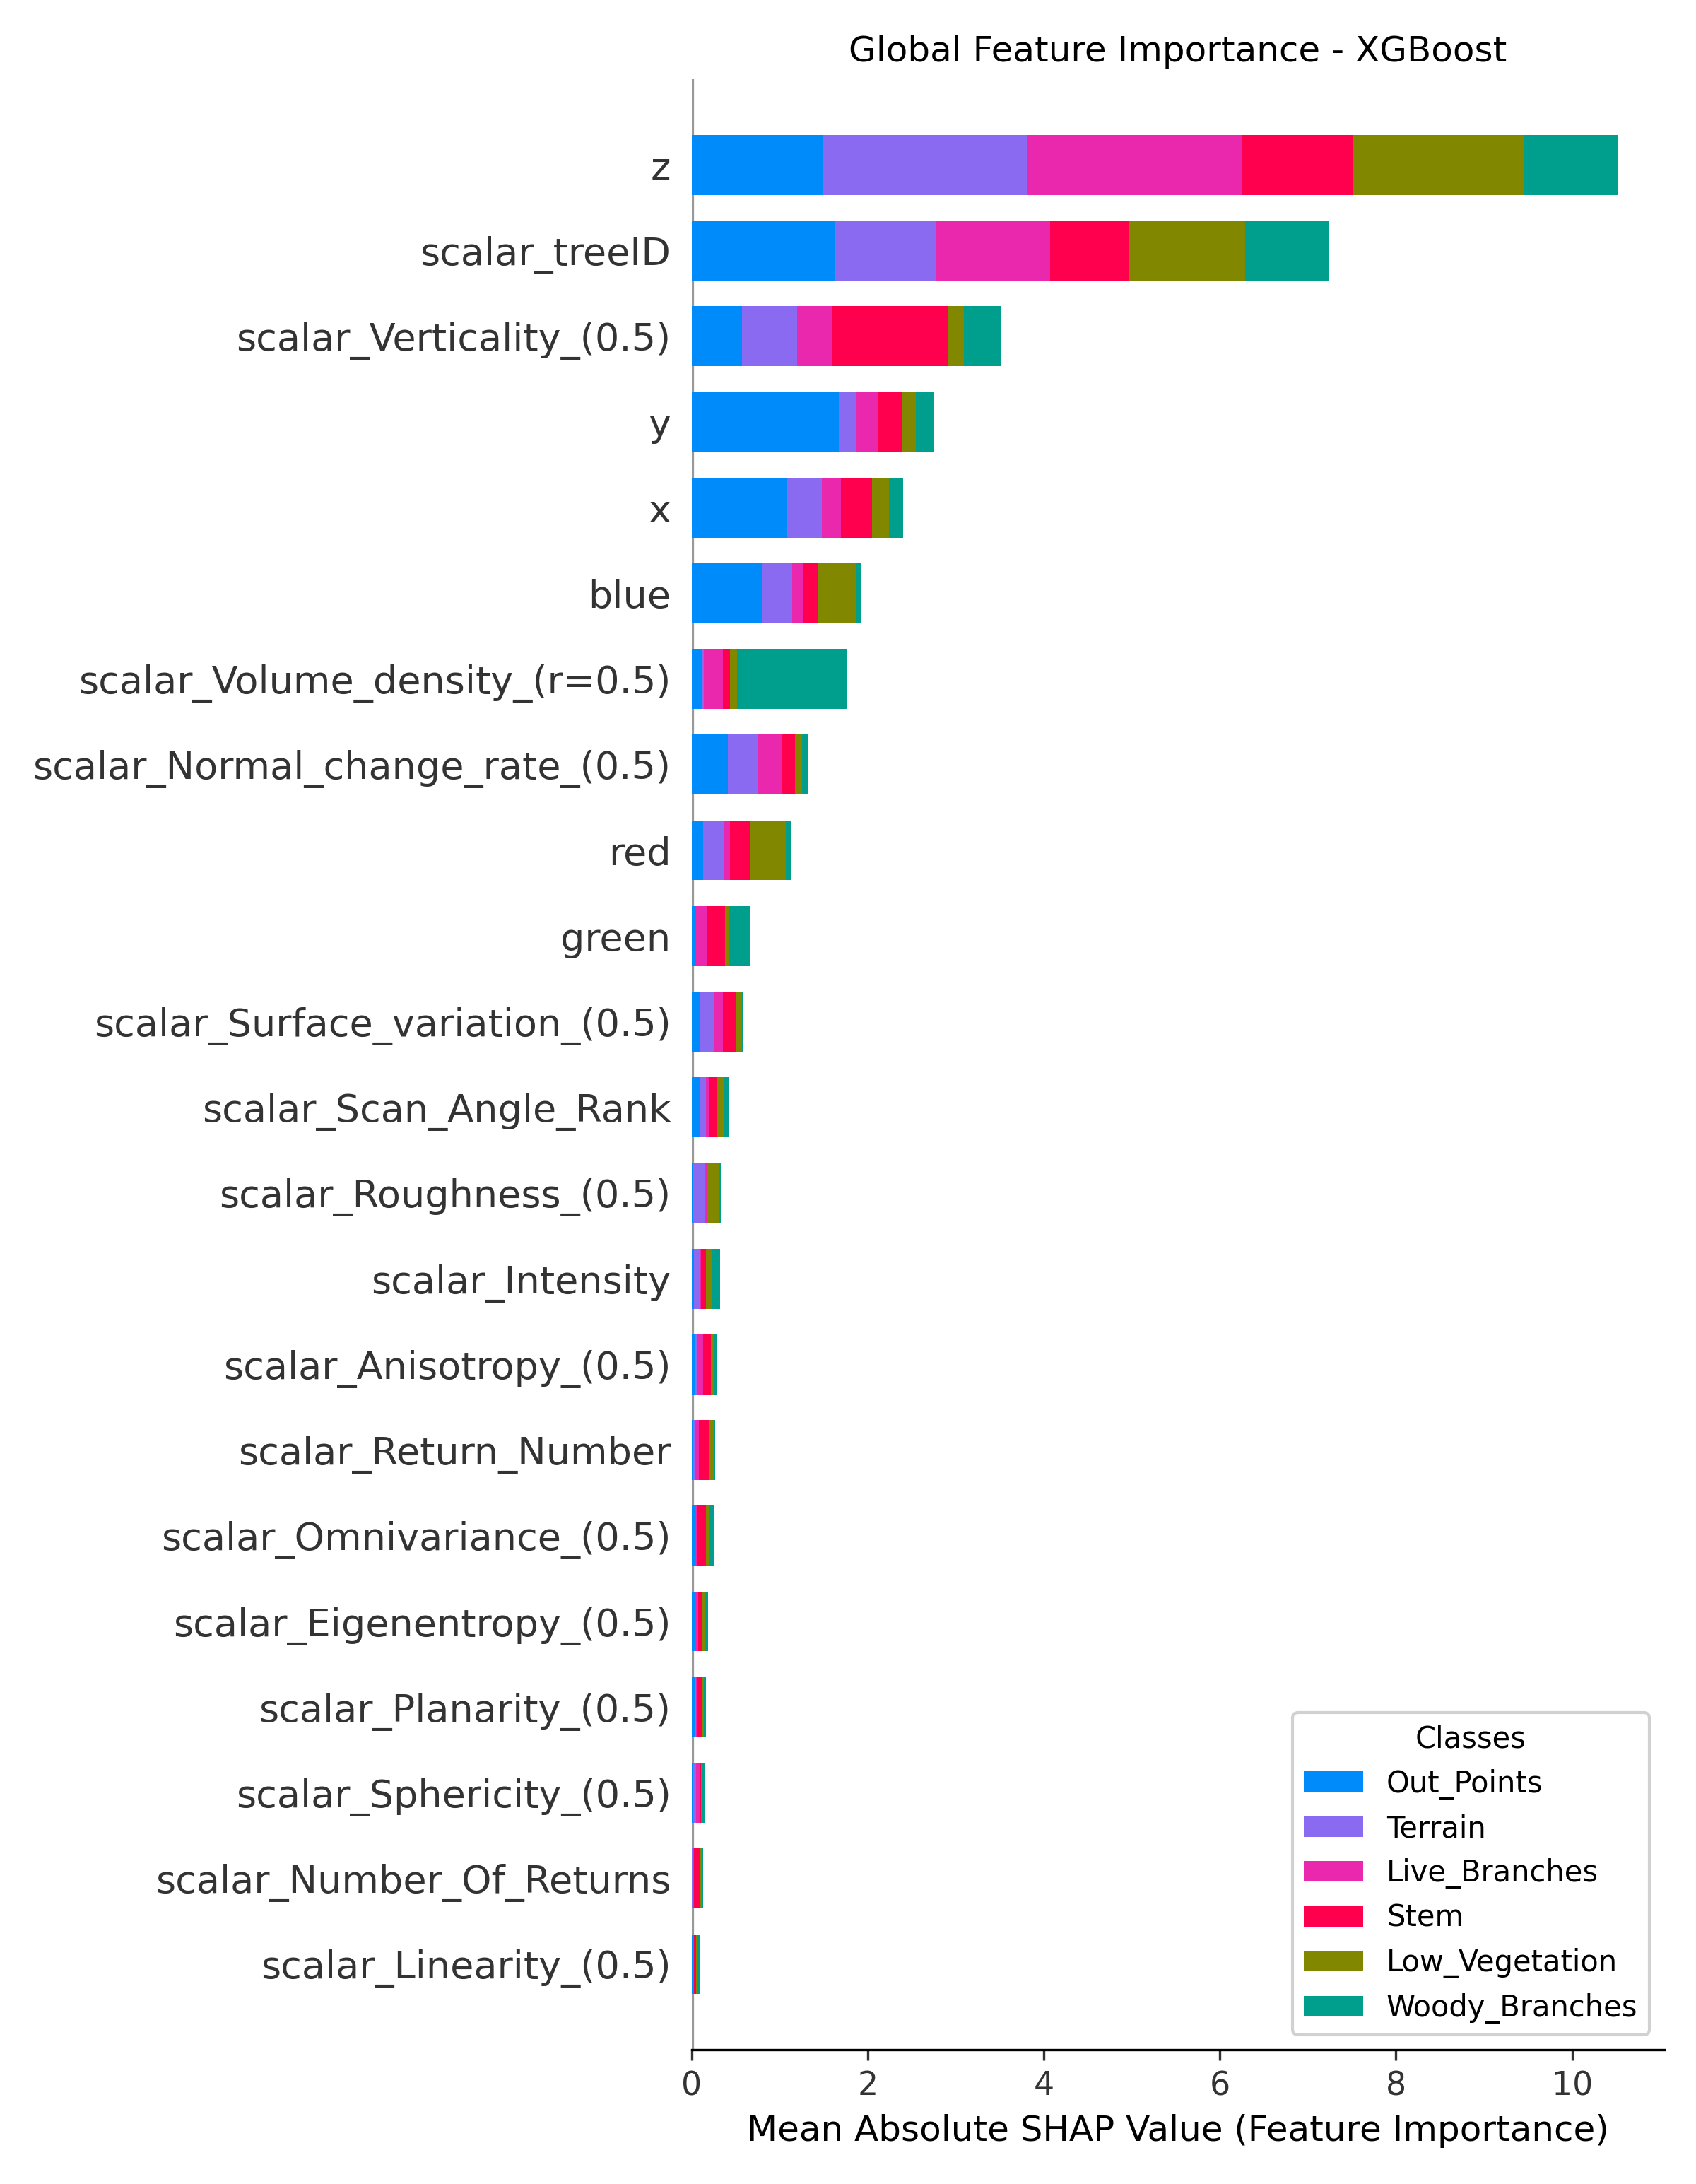
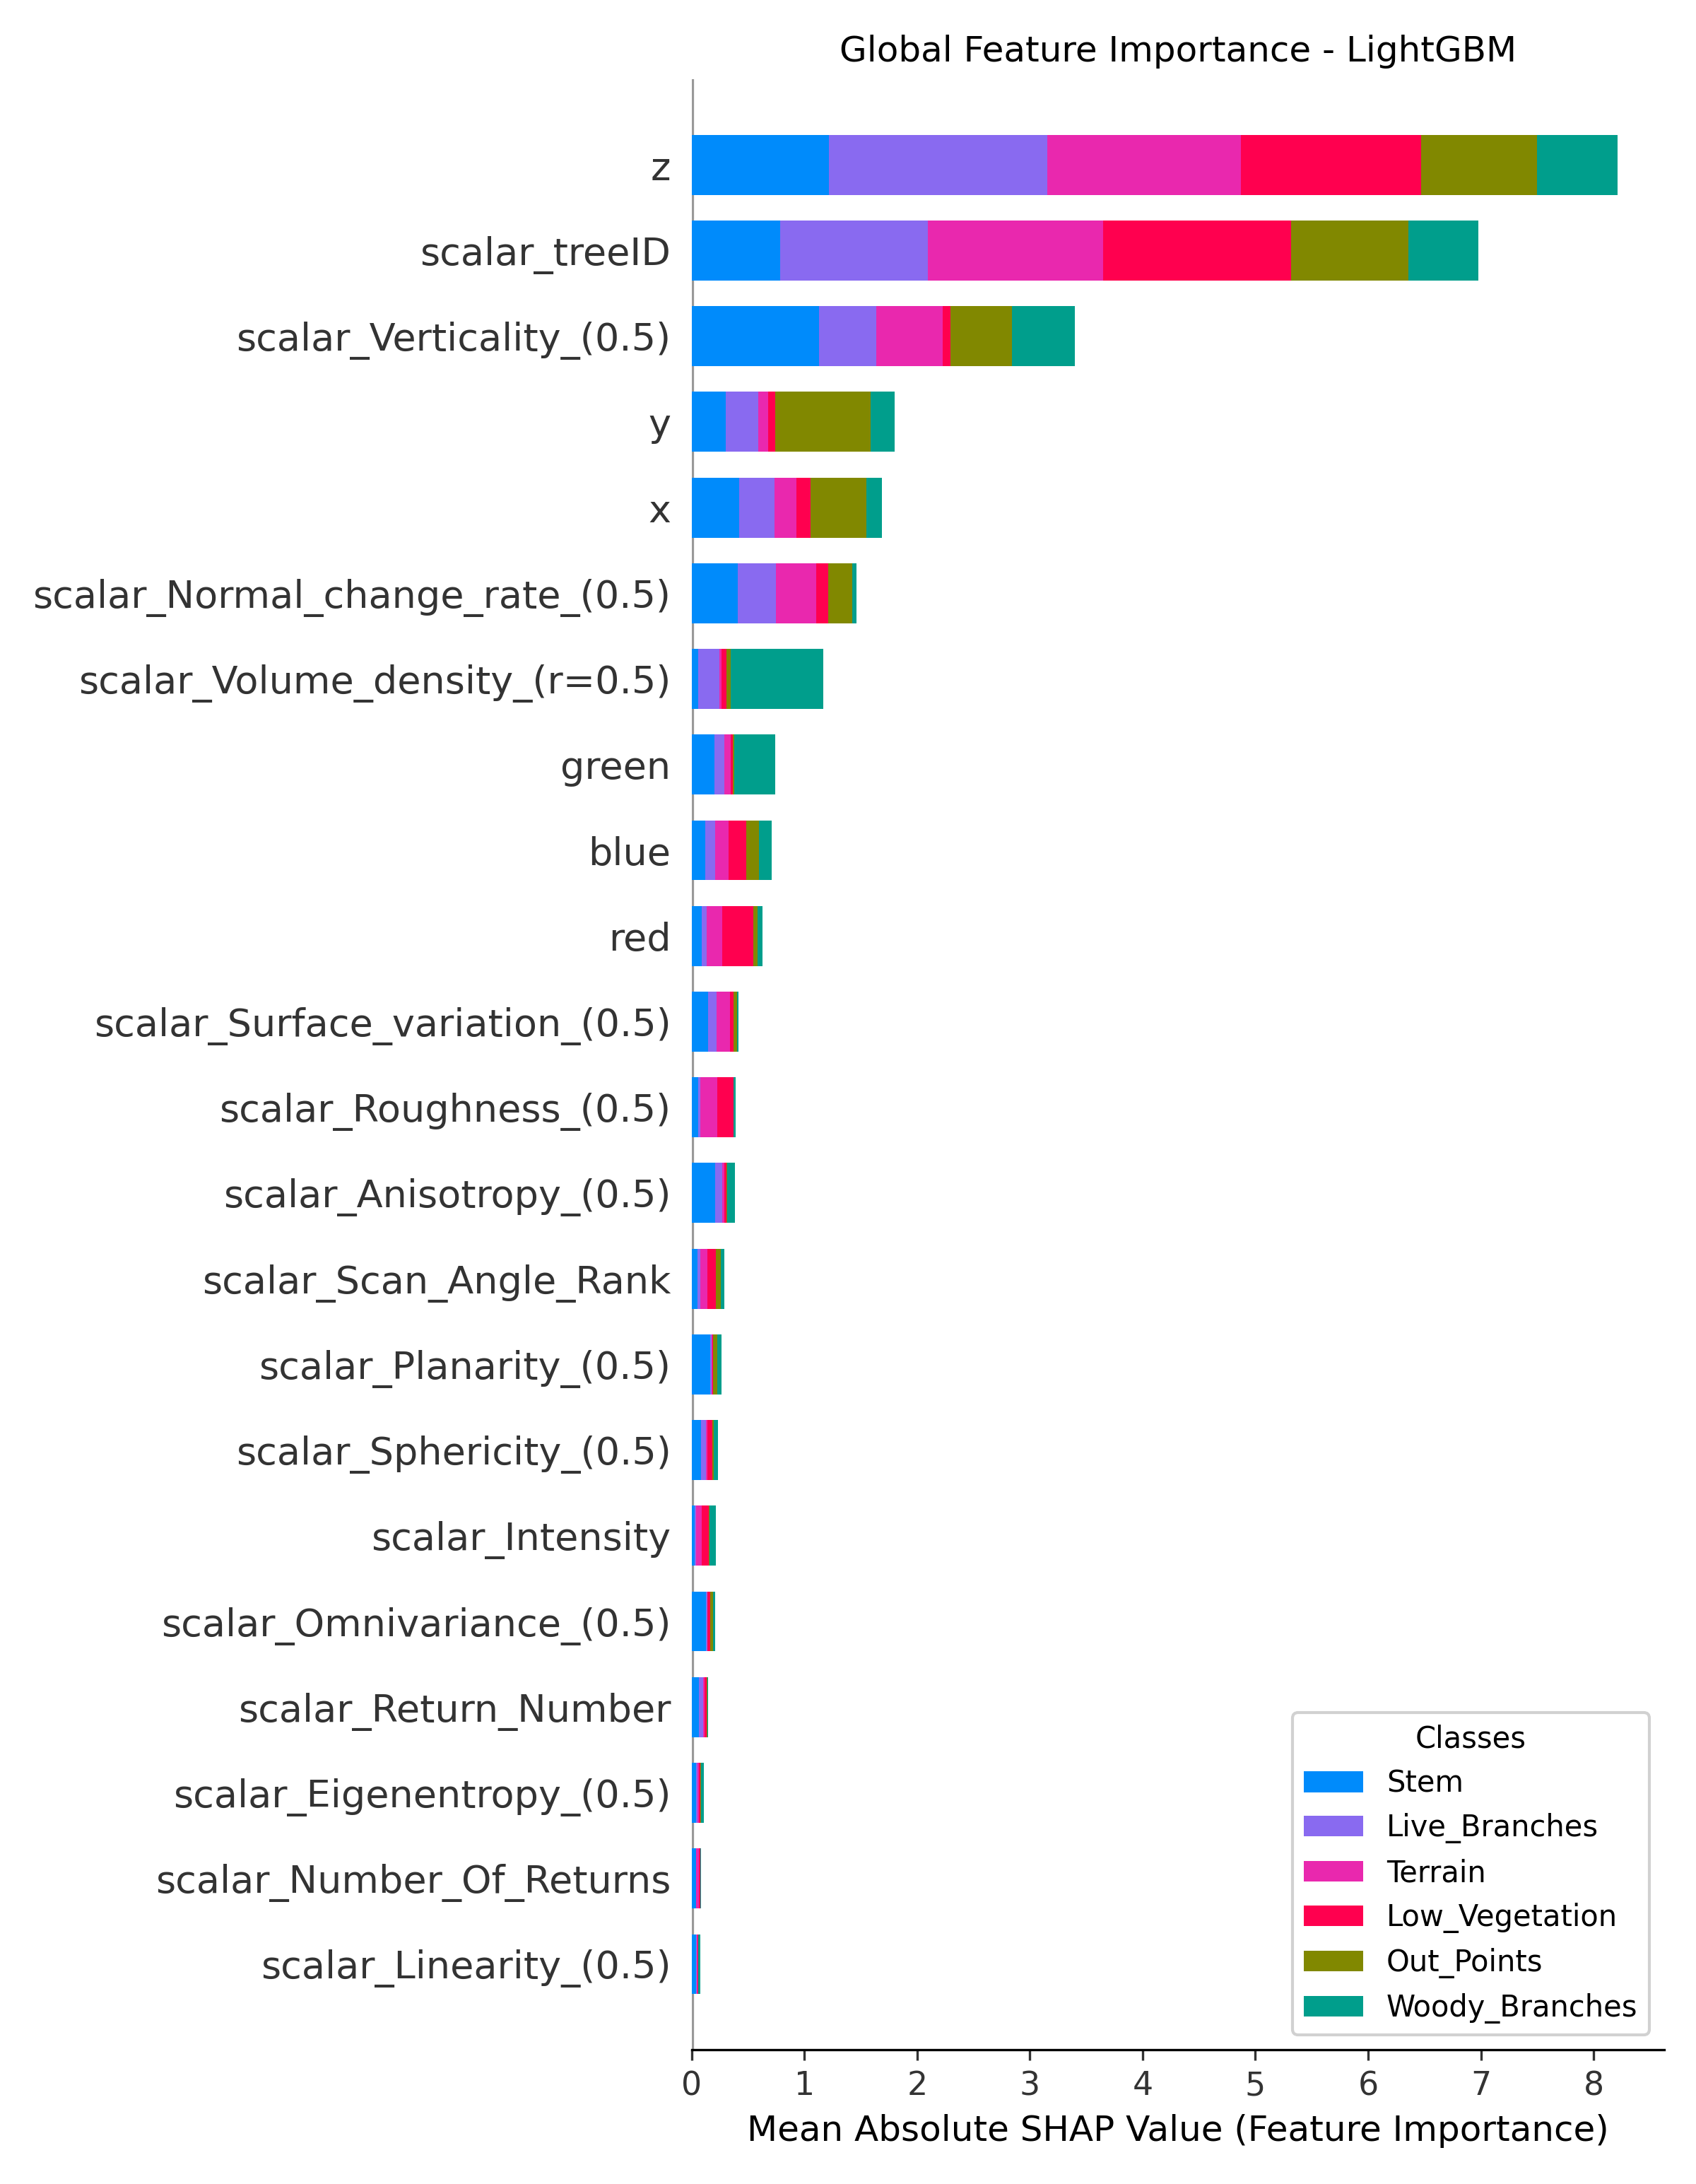
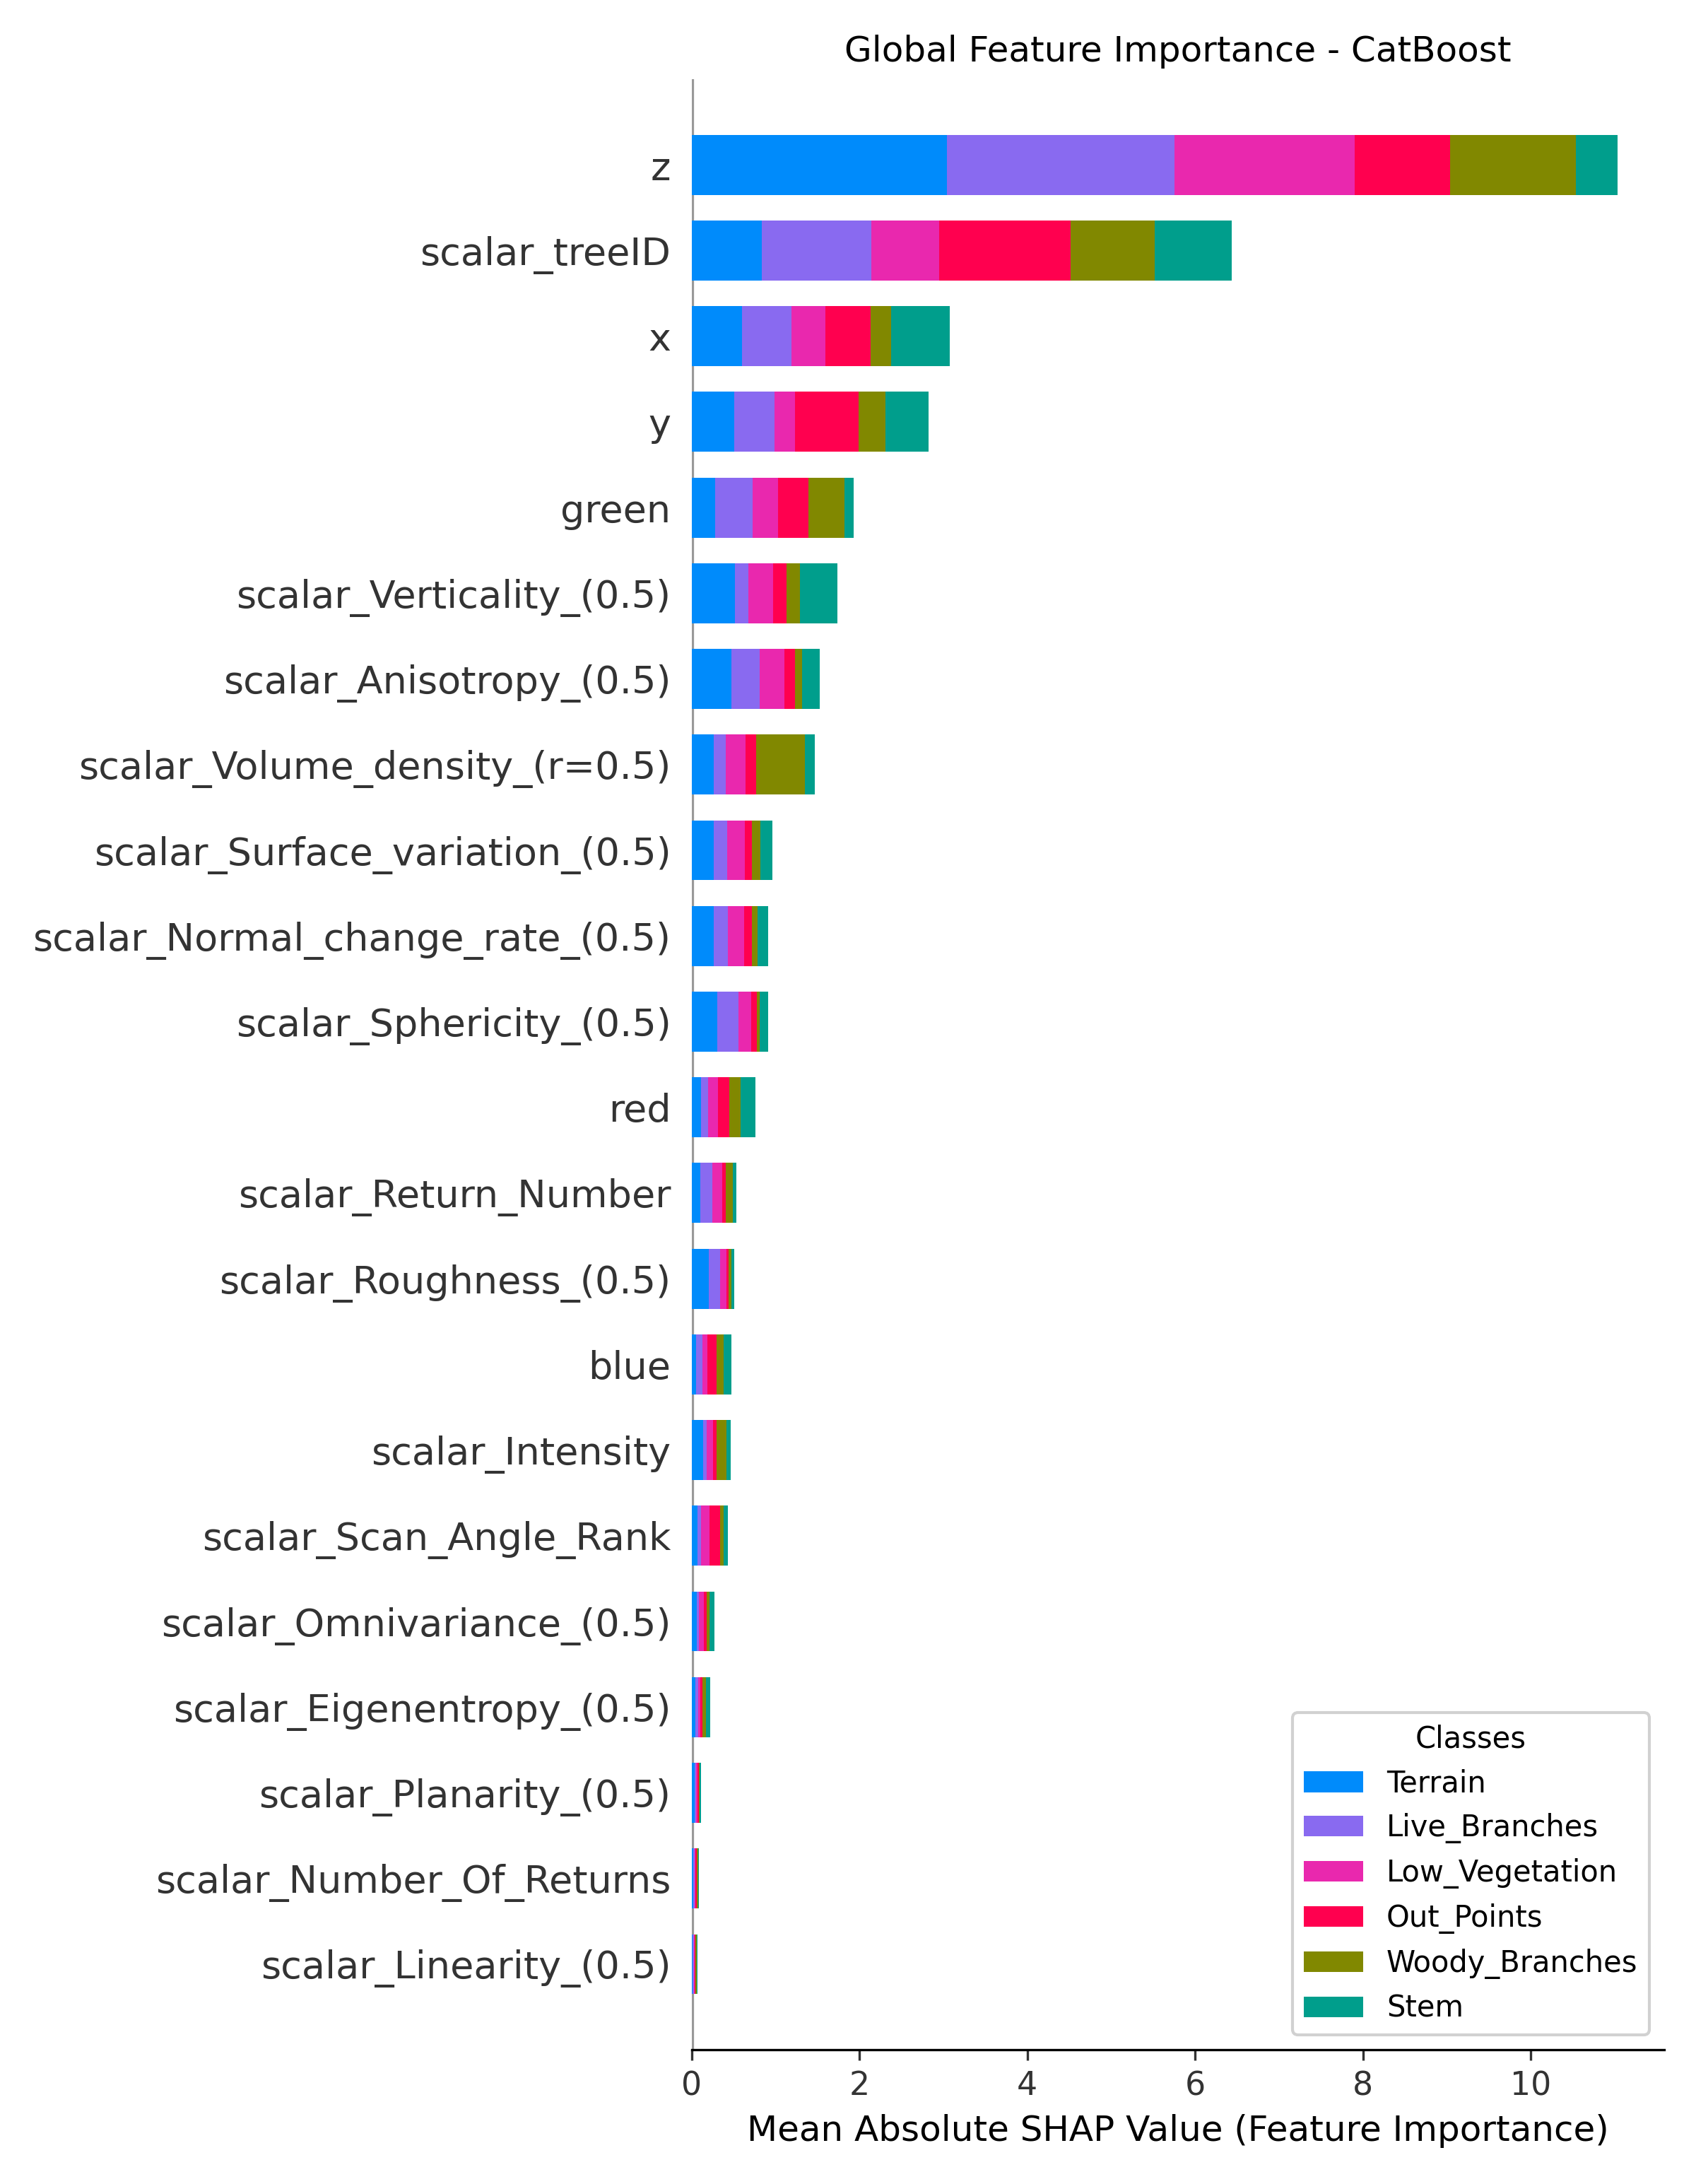
Global interpretation focuses on the overall significance and influence of features throughout the entire dataset. It is shown in the plots that the height (Z) has the most feature importance value in each class. Verticality and volume density are also important features. Normal change rate is crucial, indicating that changes in normal vectors play a significant role. The height feature (Z) is analytical for distinguishing between classes, particularly for Terrain, Low-vegetation, and Stem.
2. Local SHAP Analysis
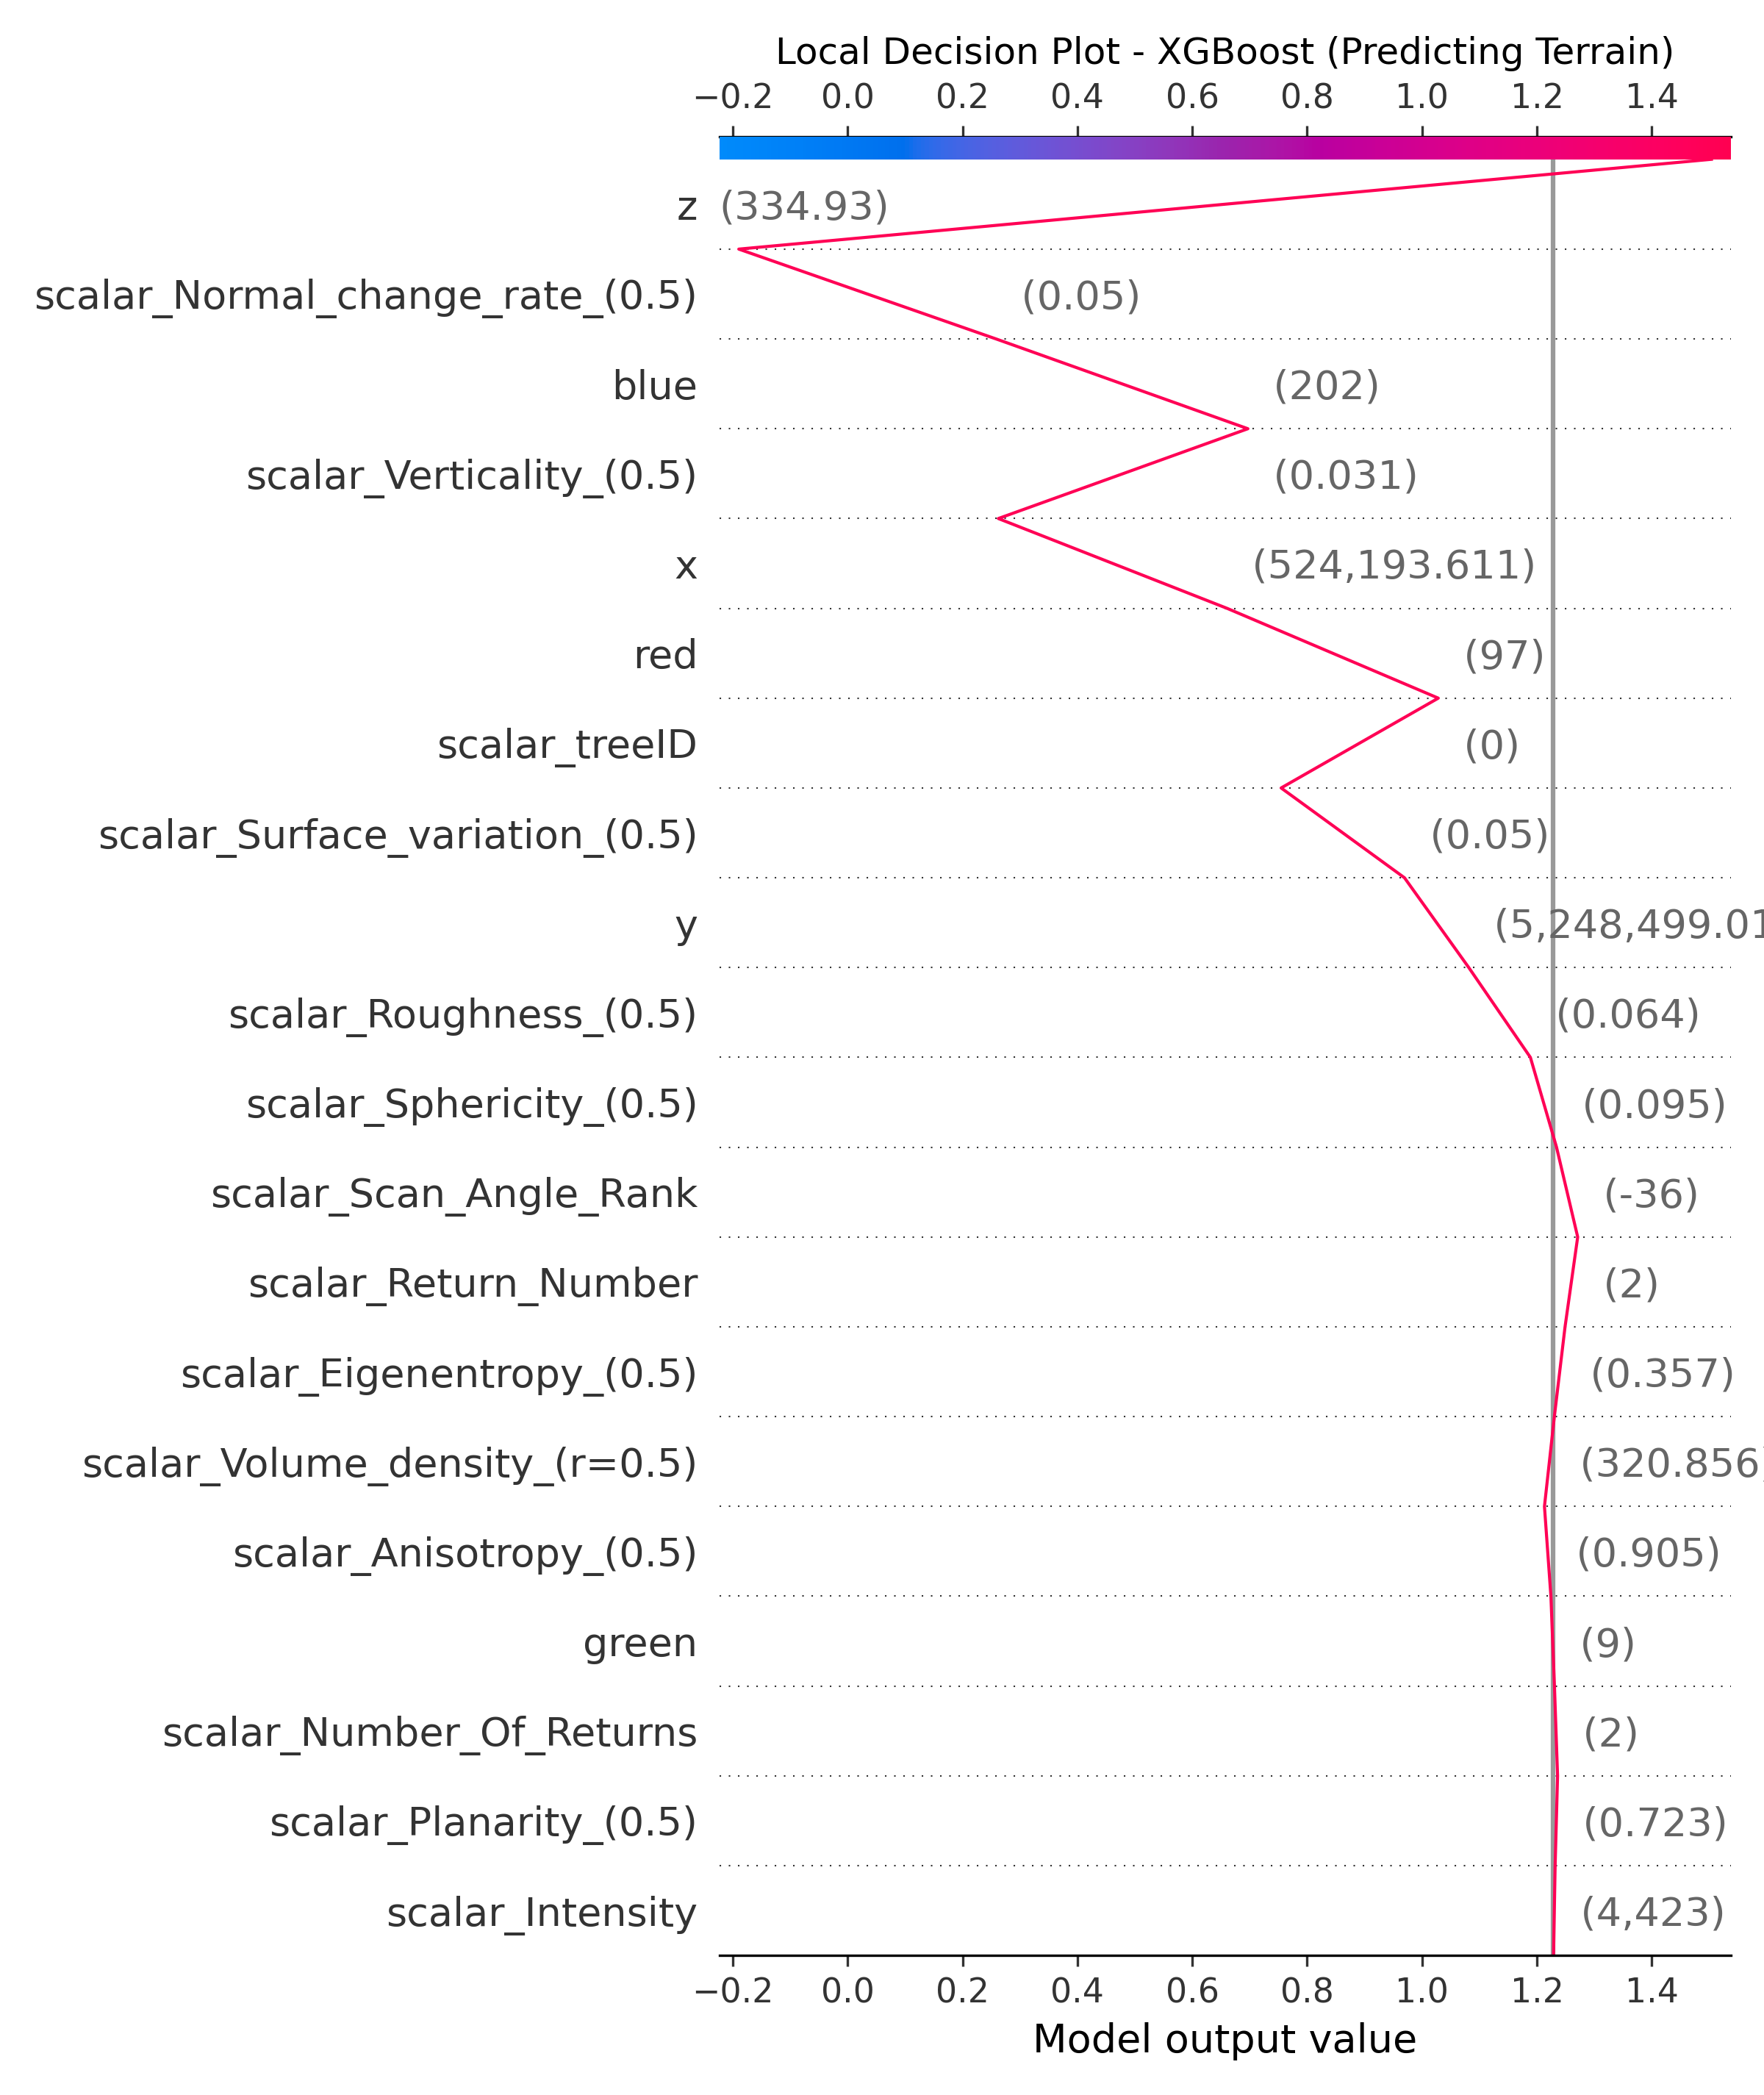
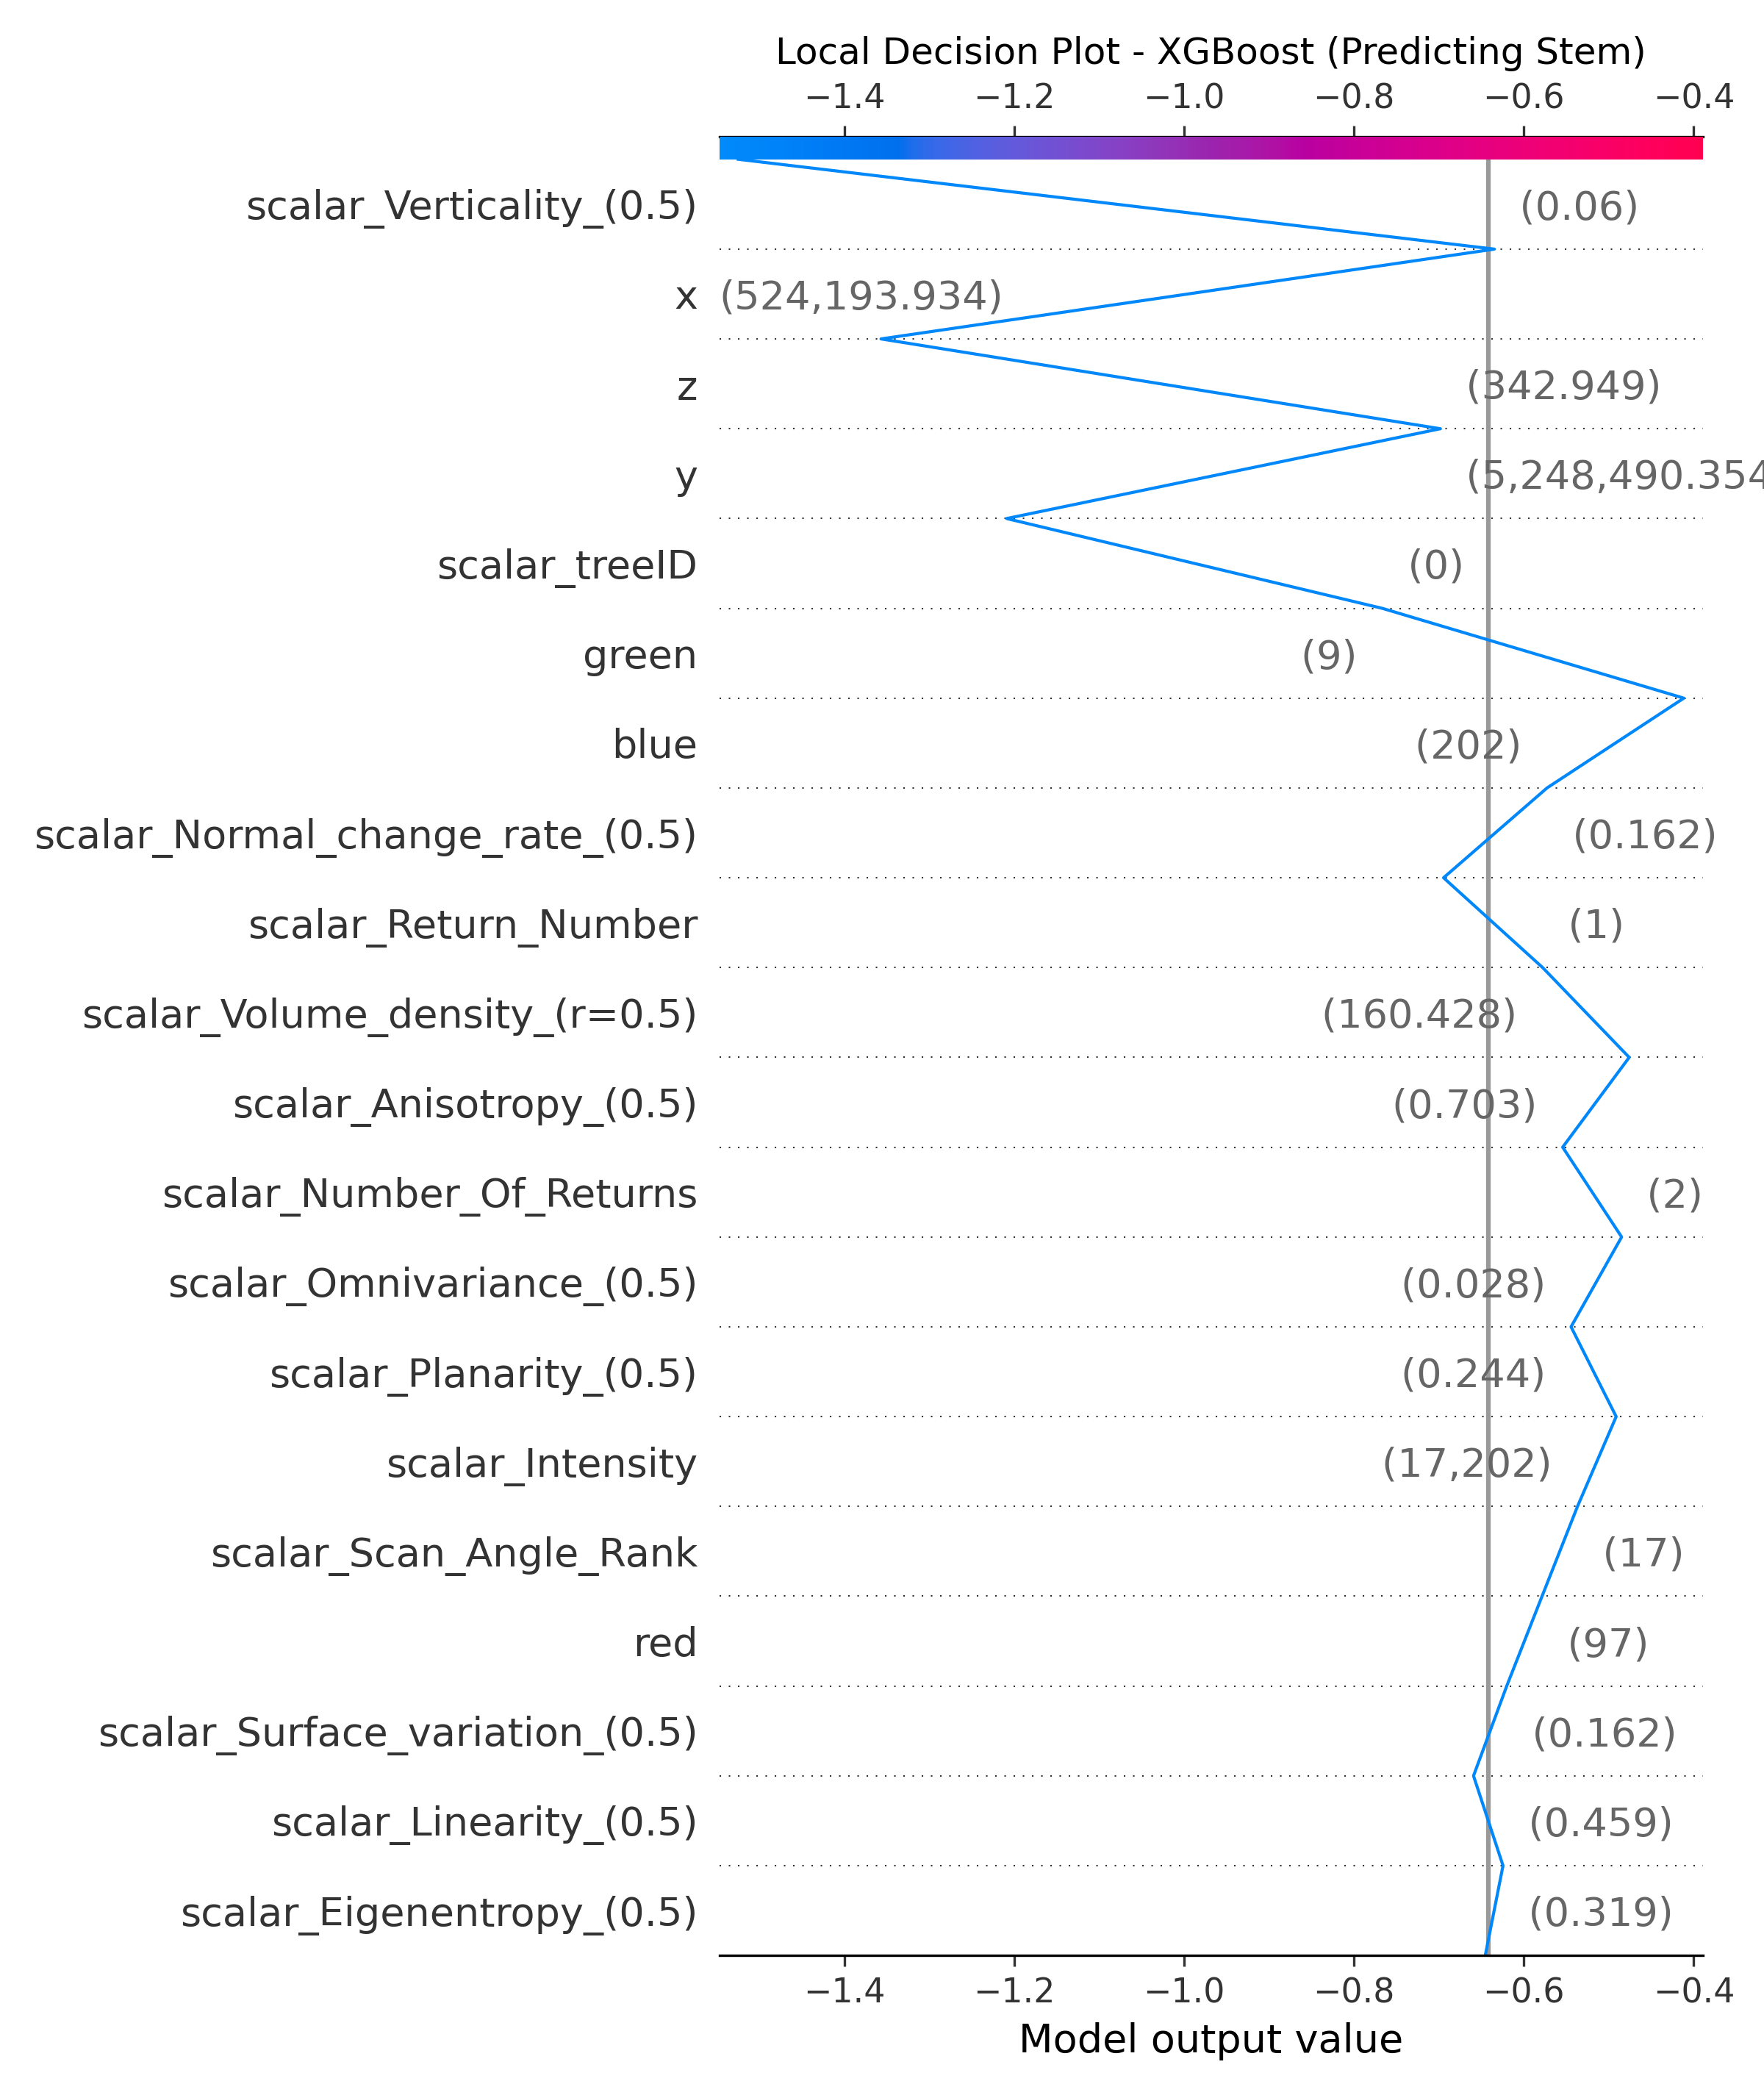
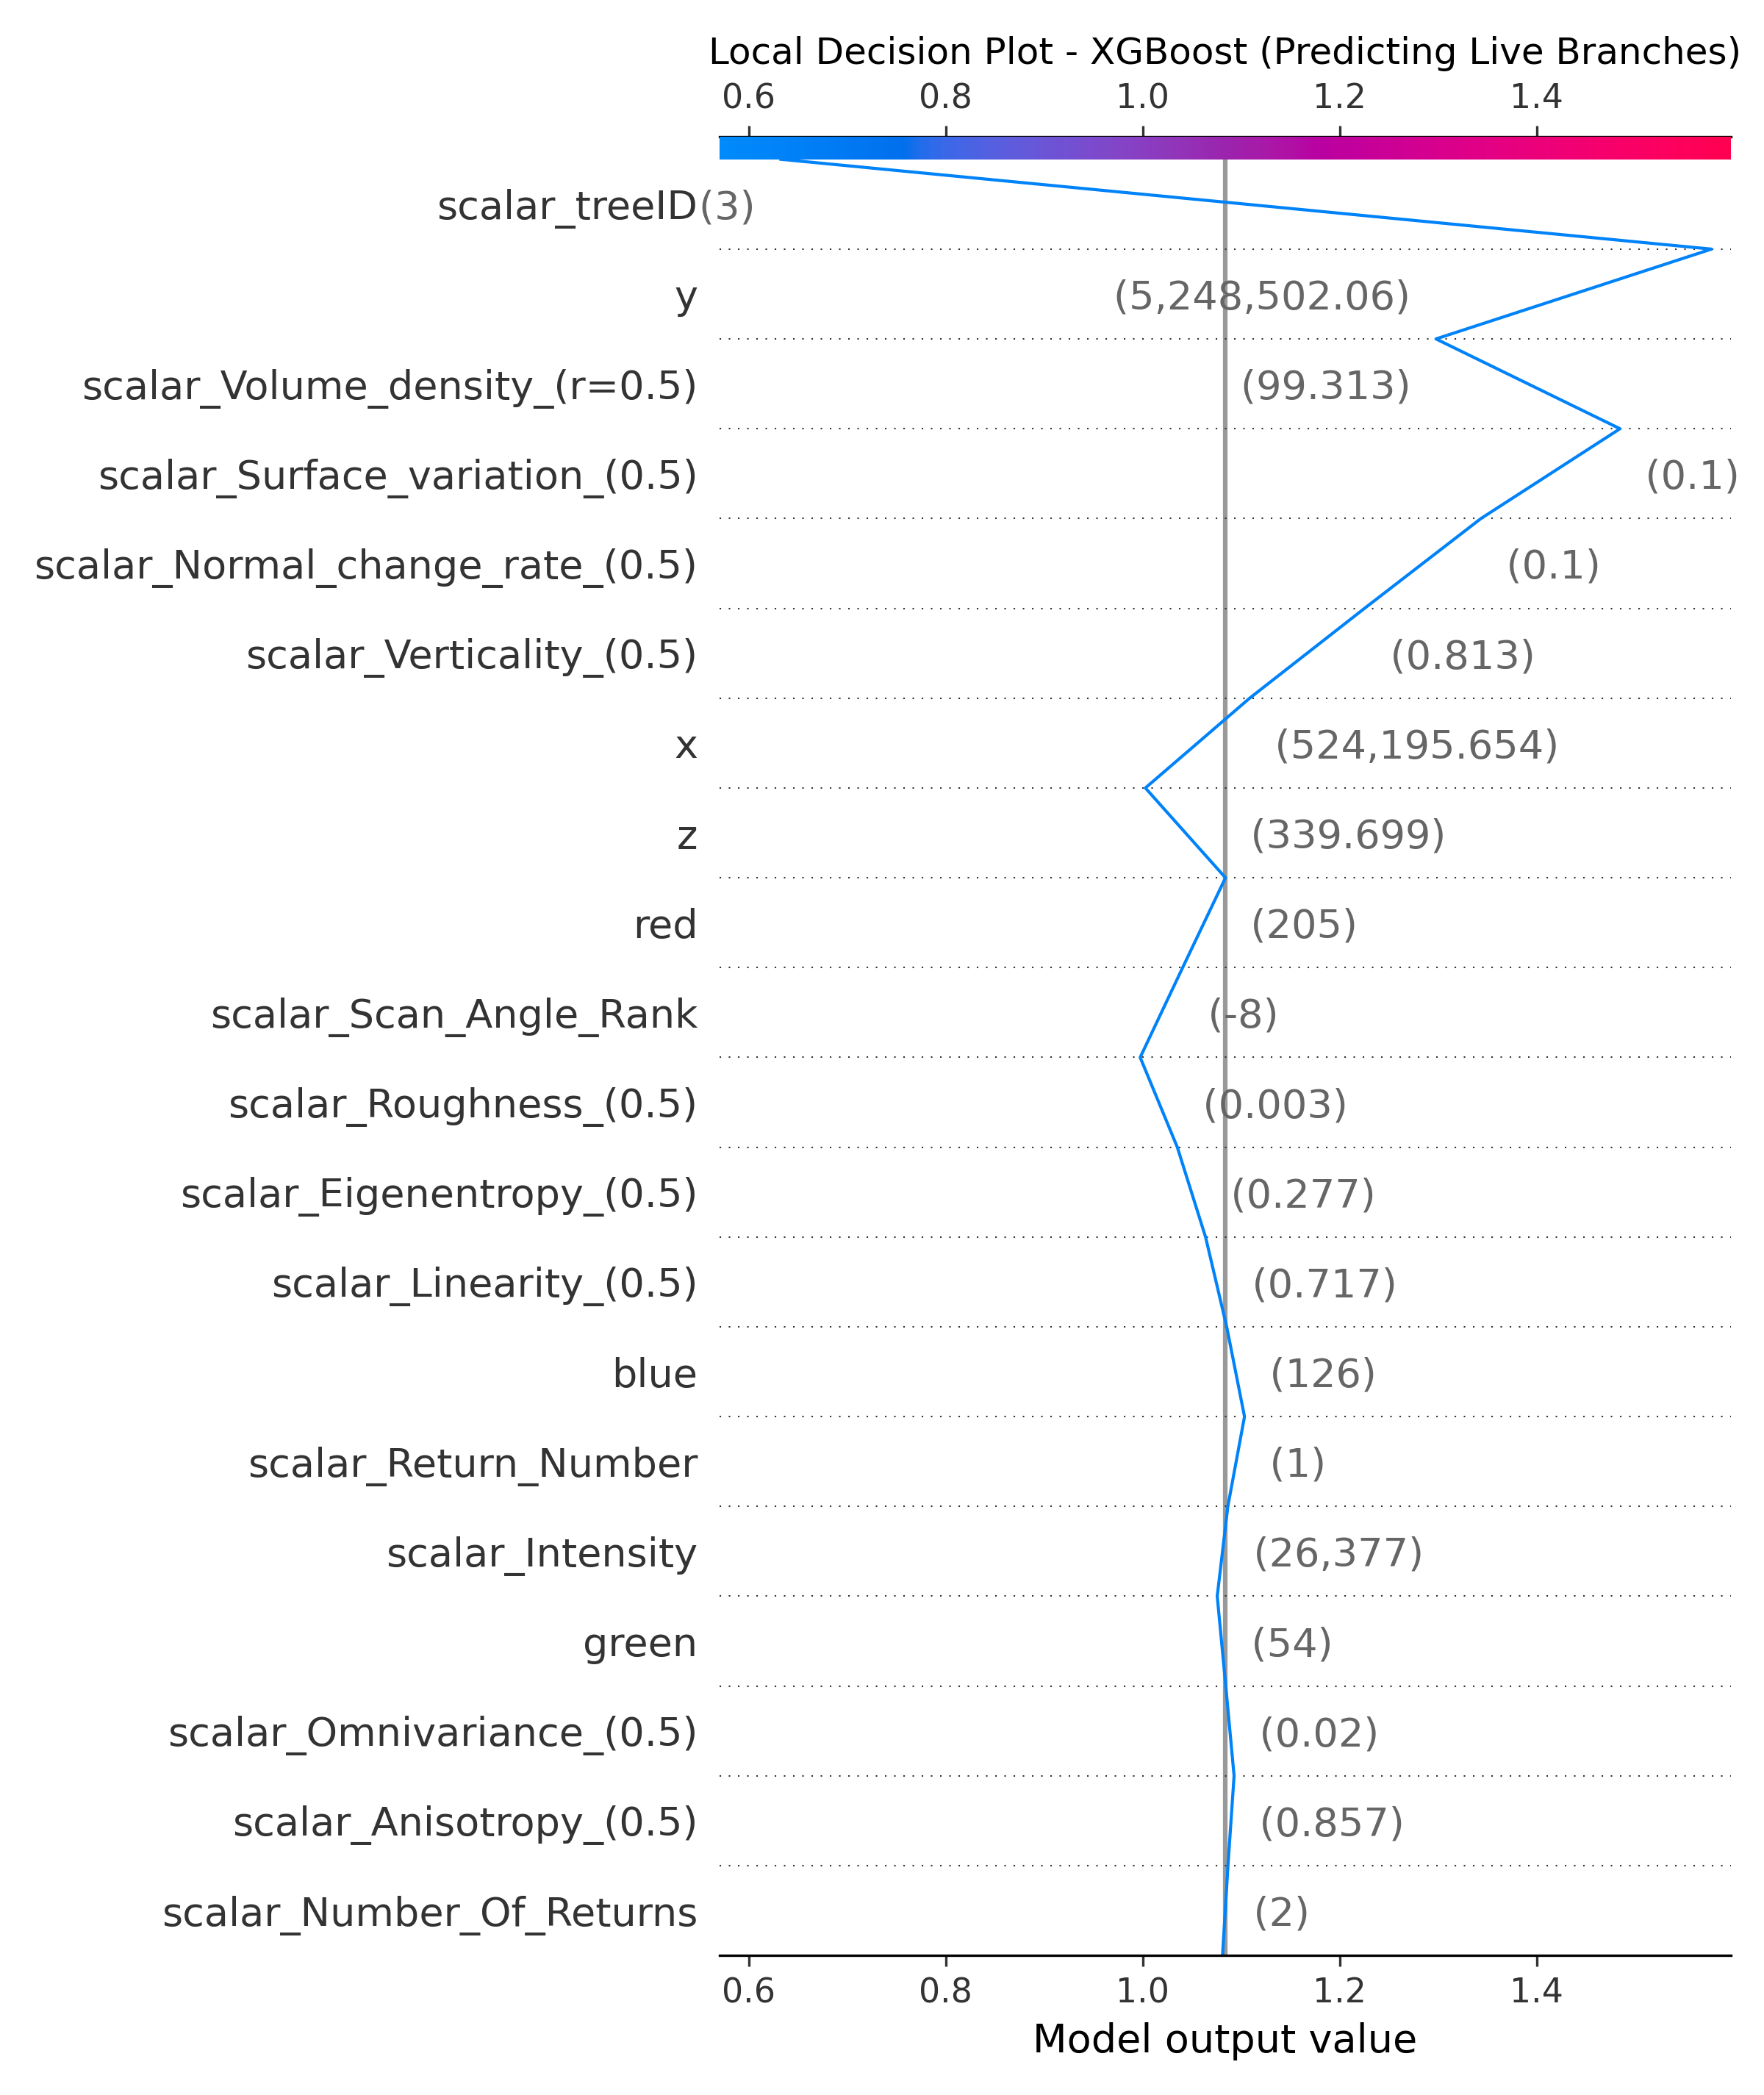
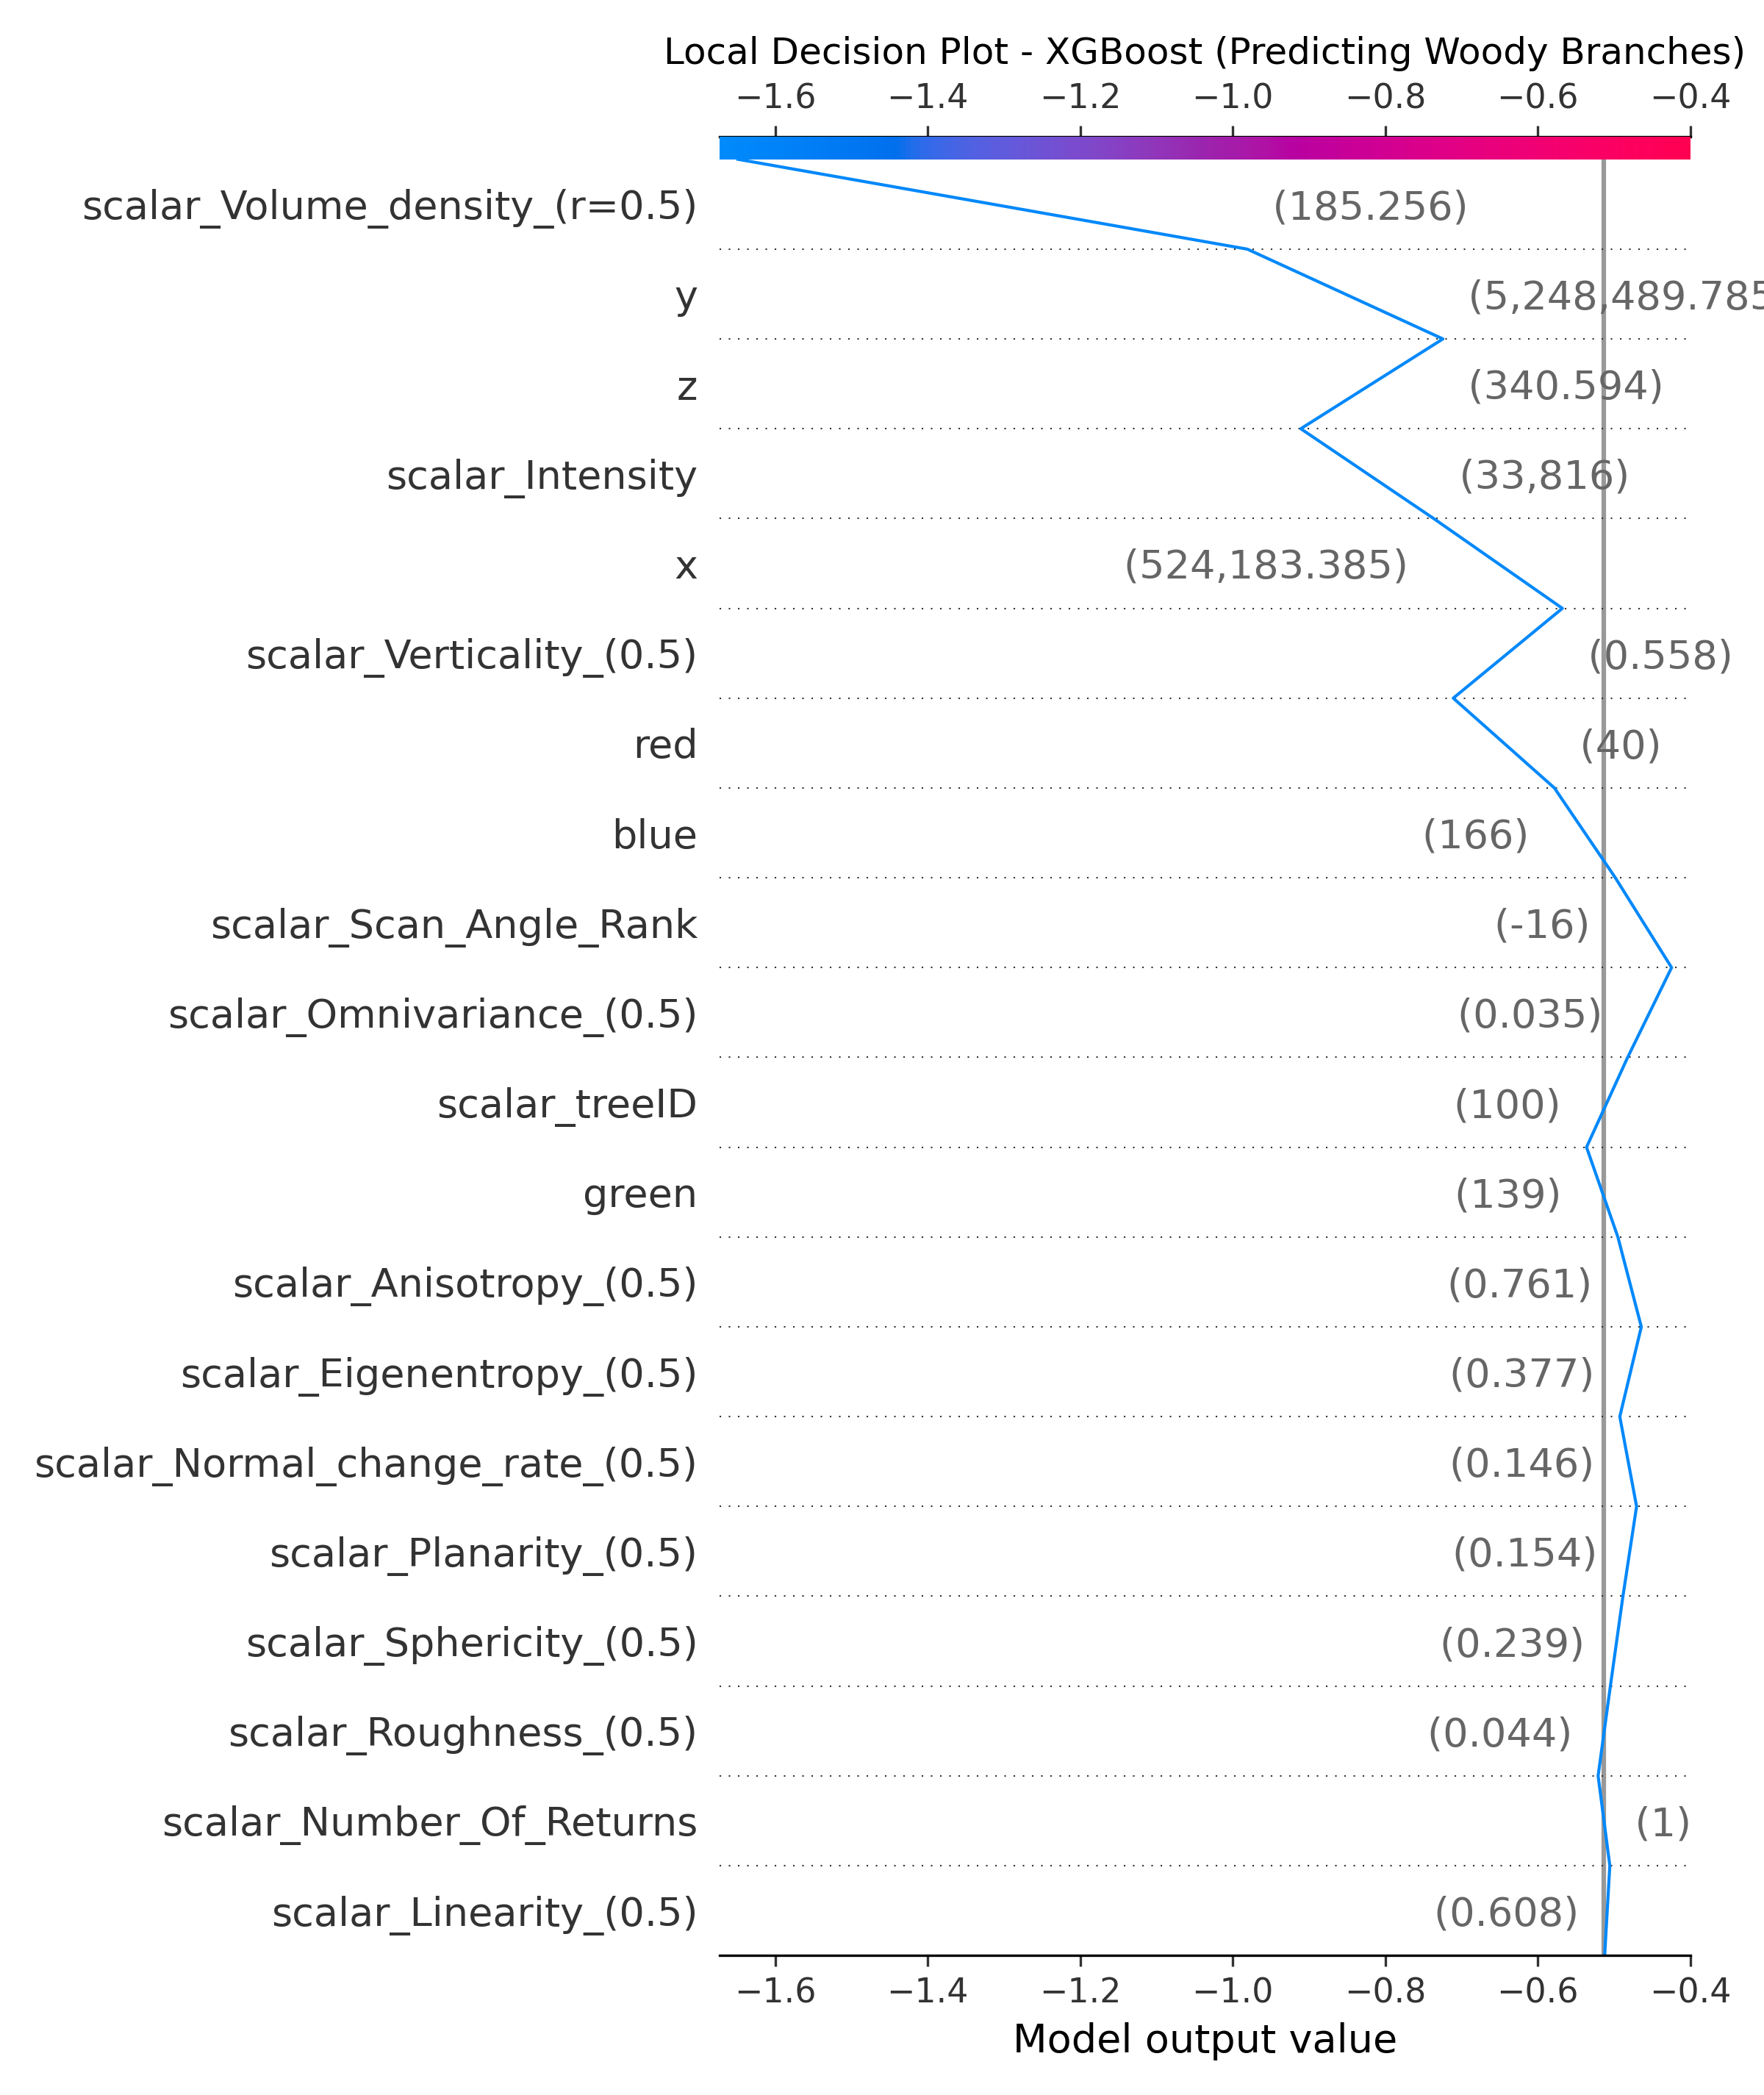
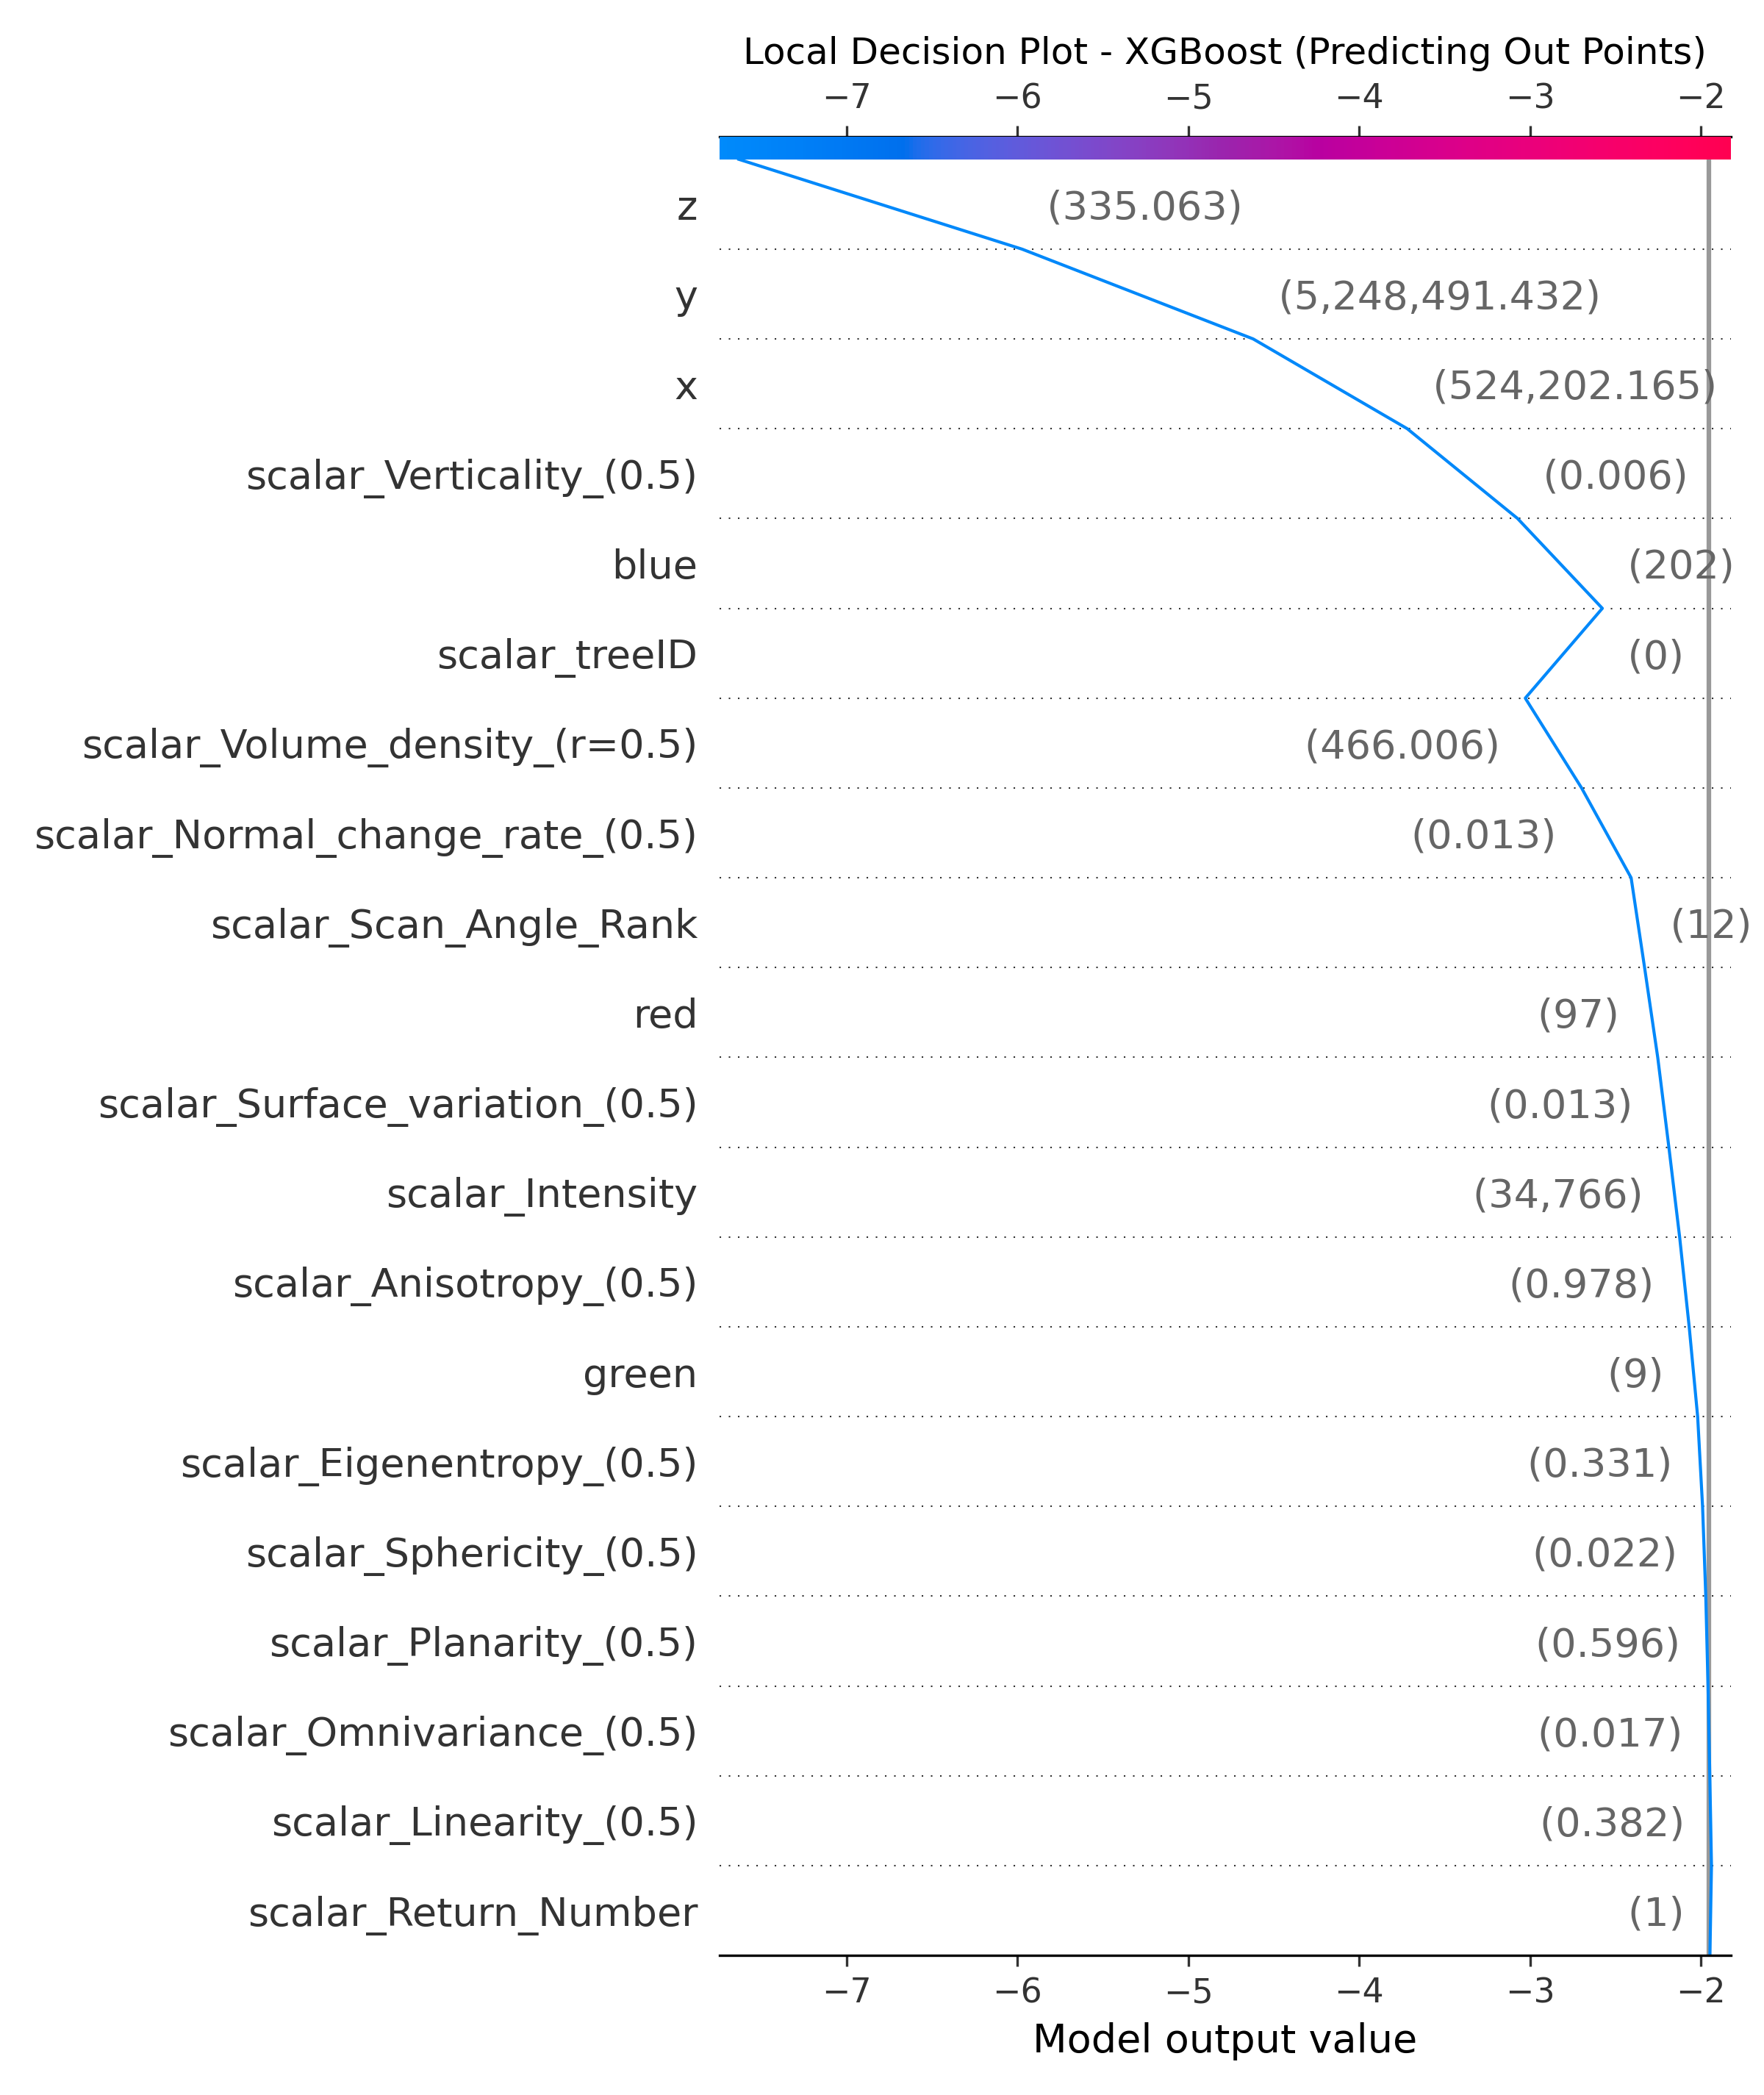
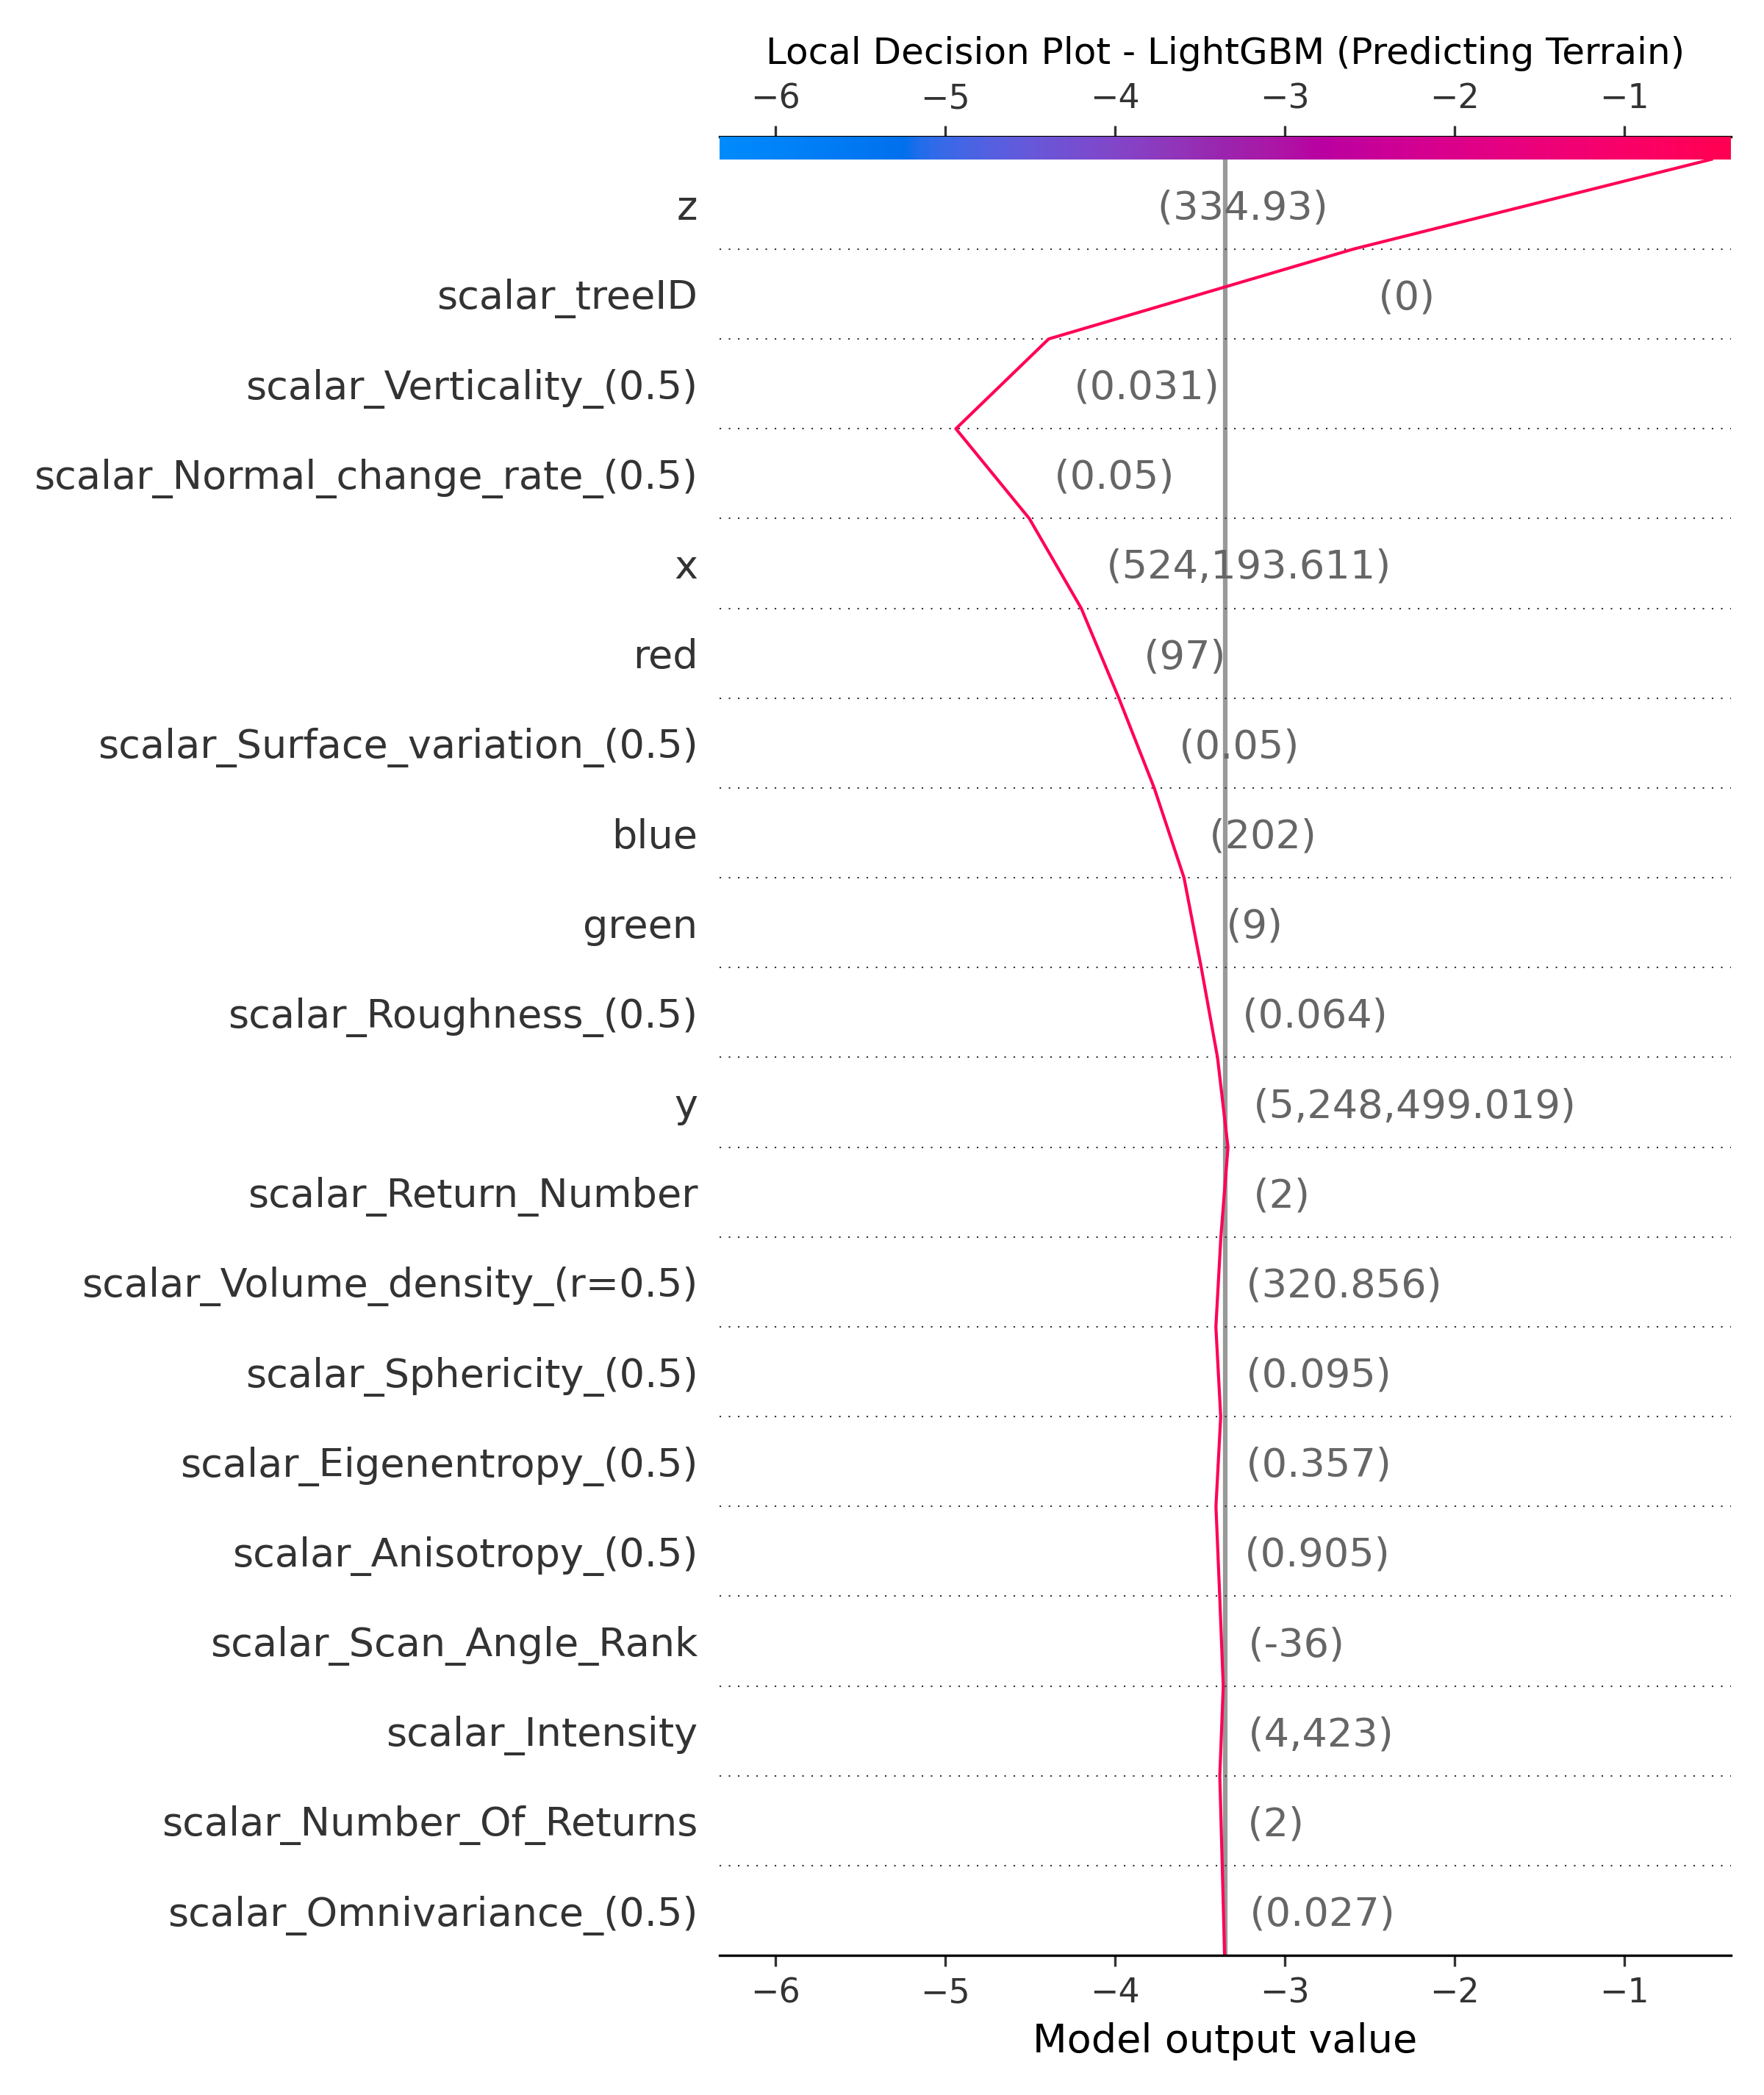
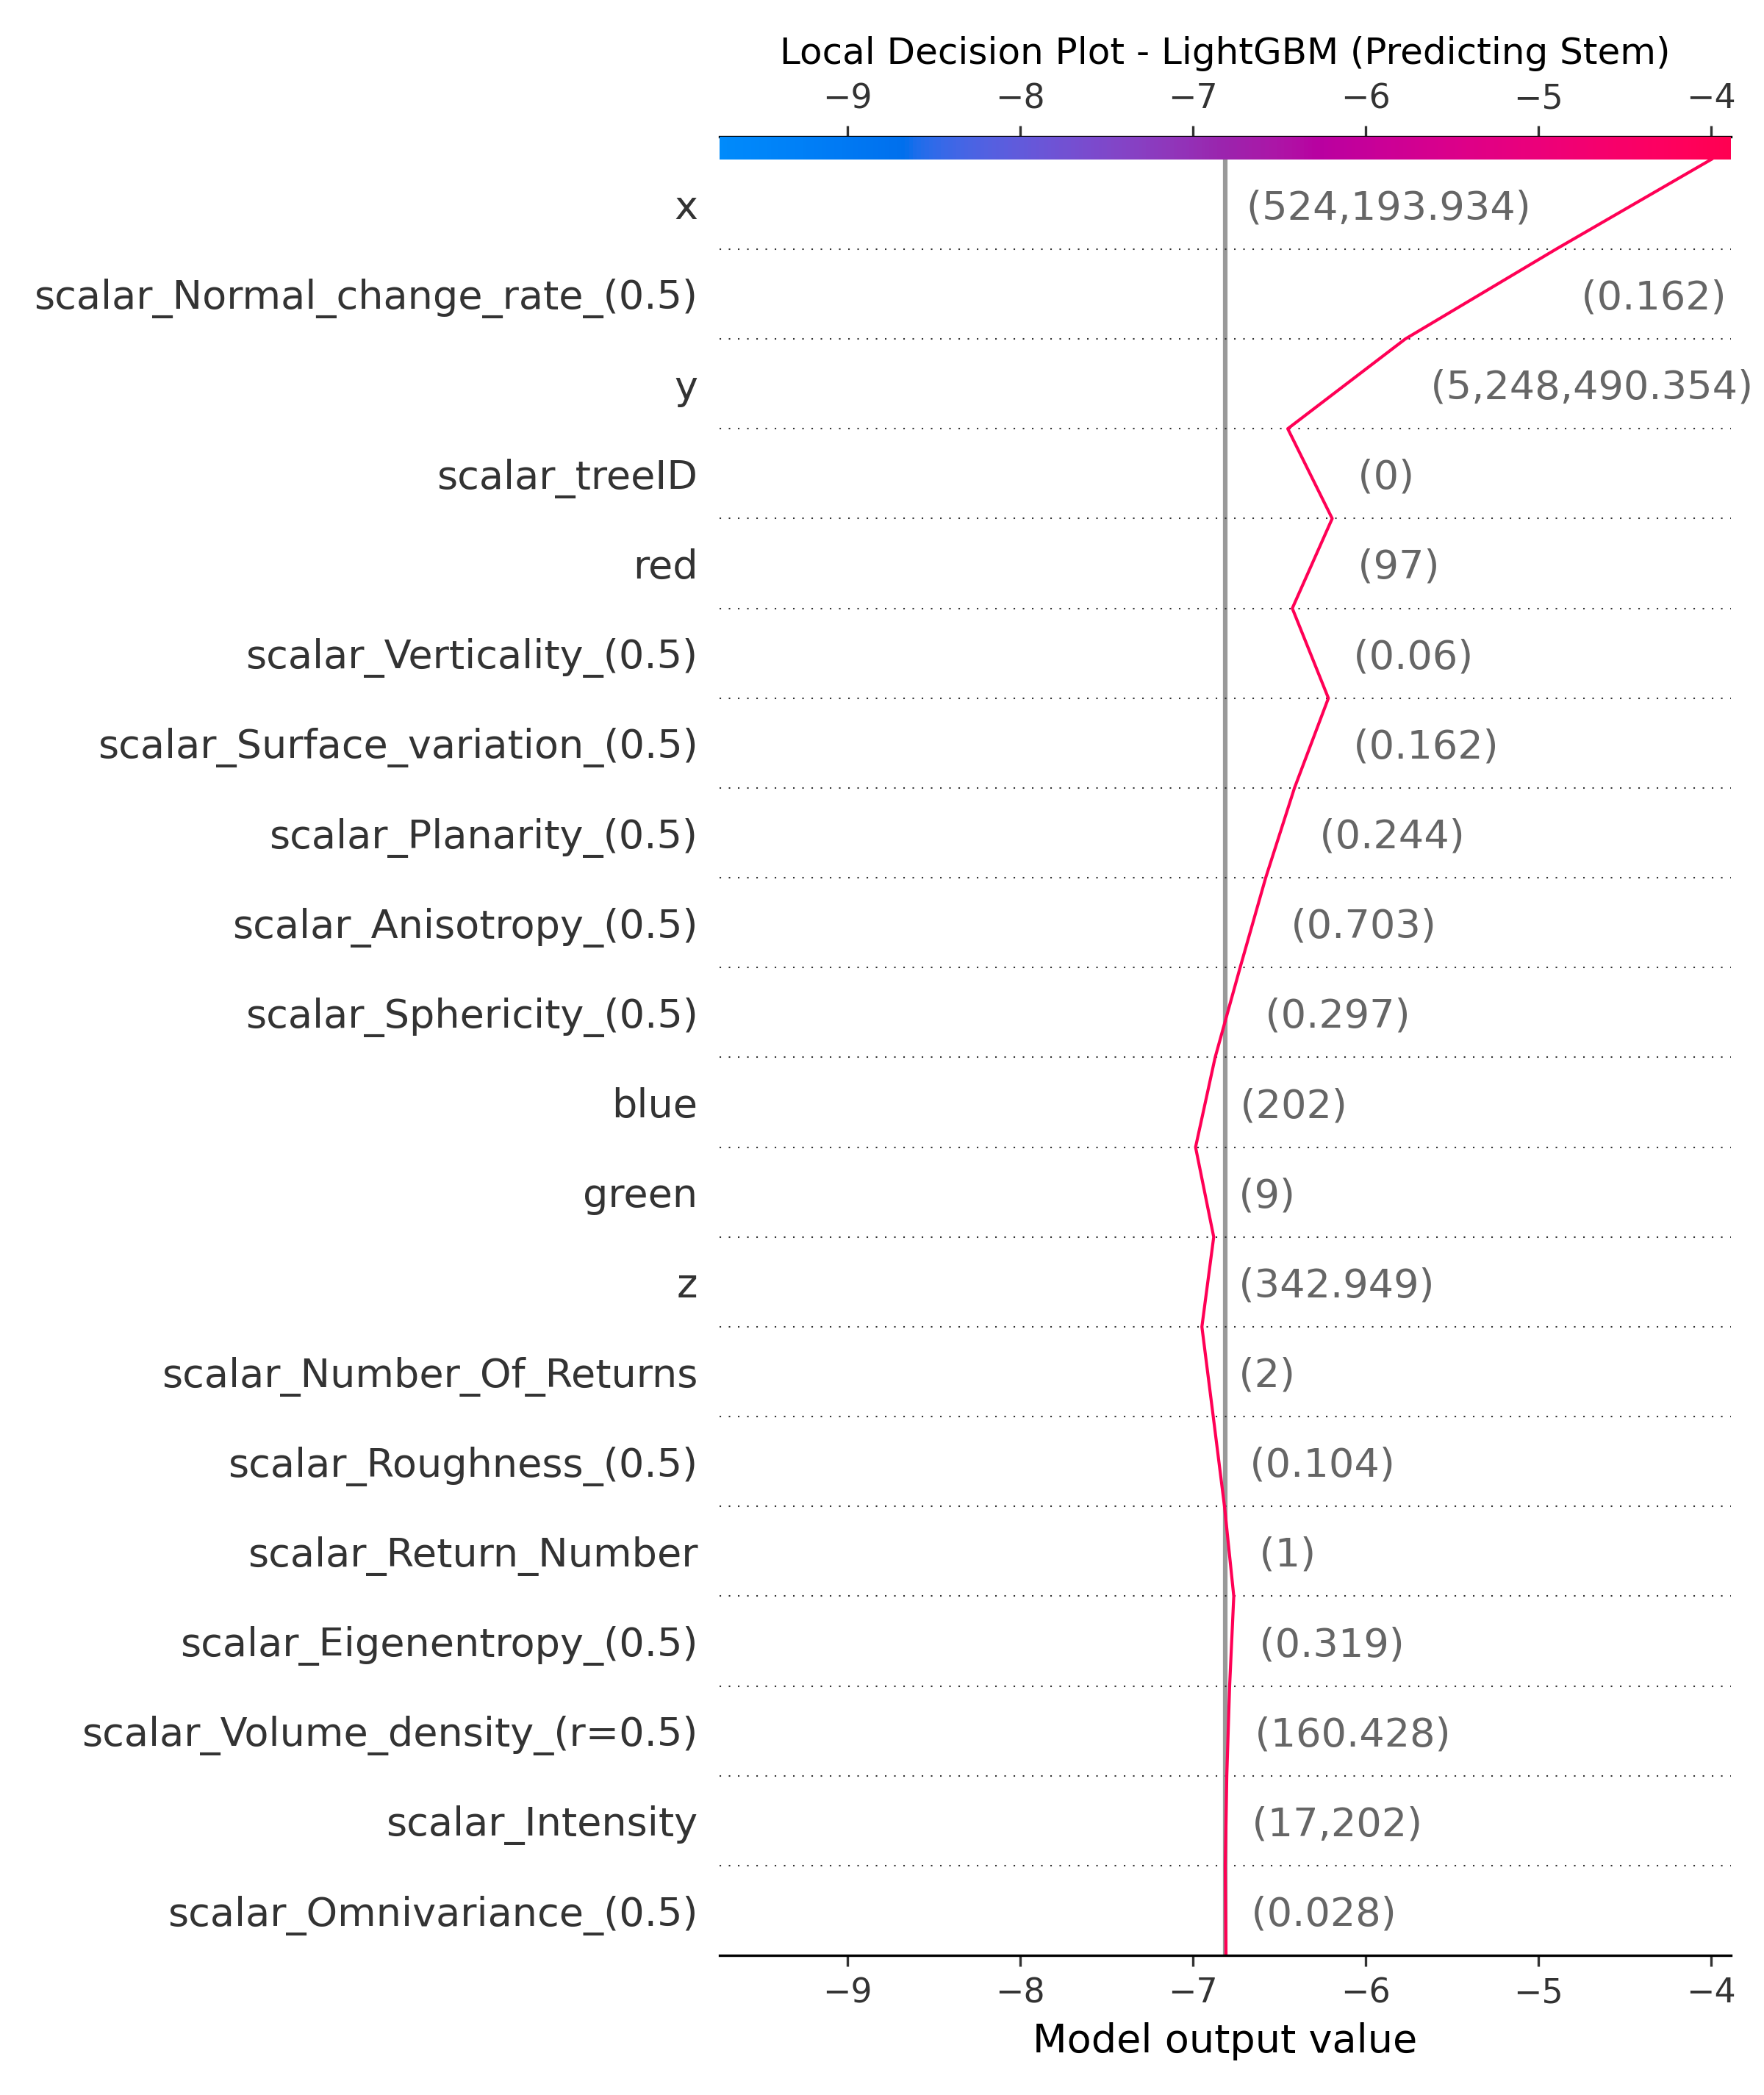
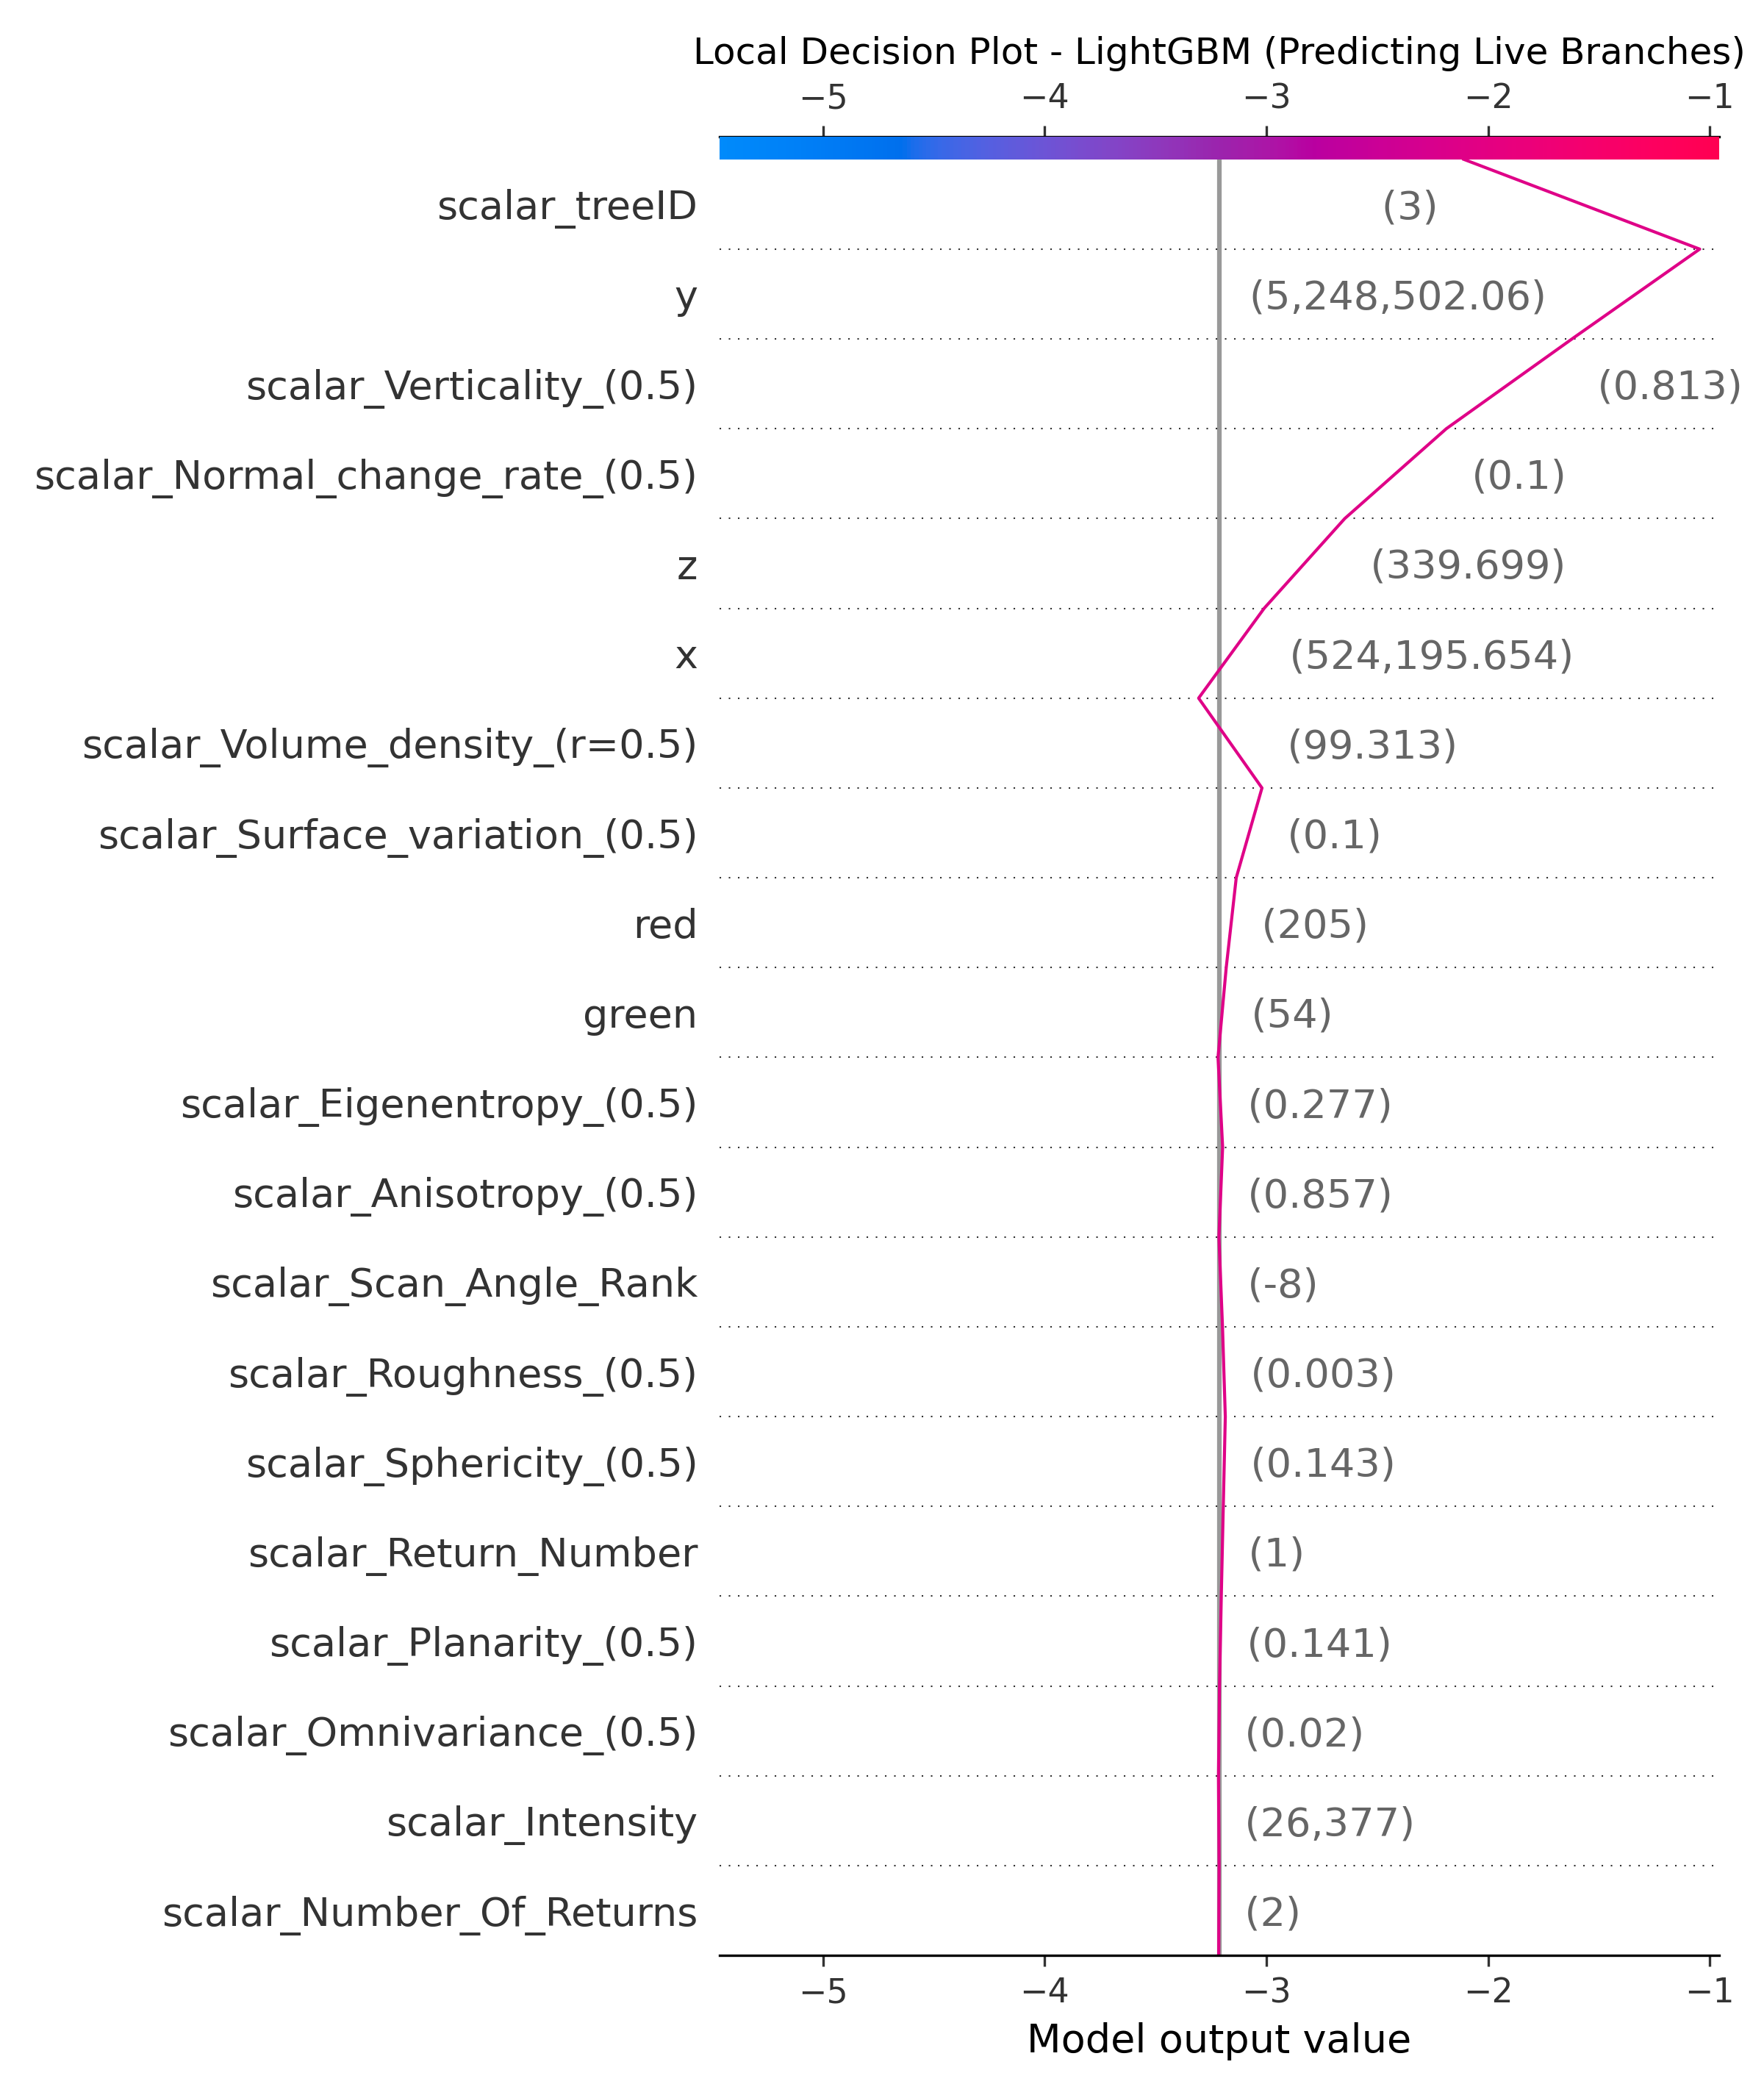
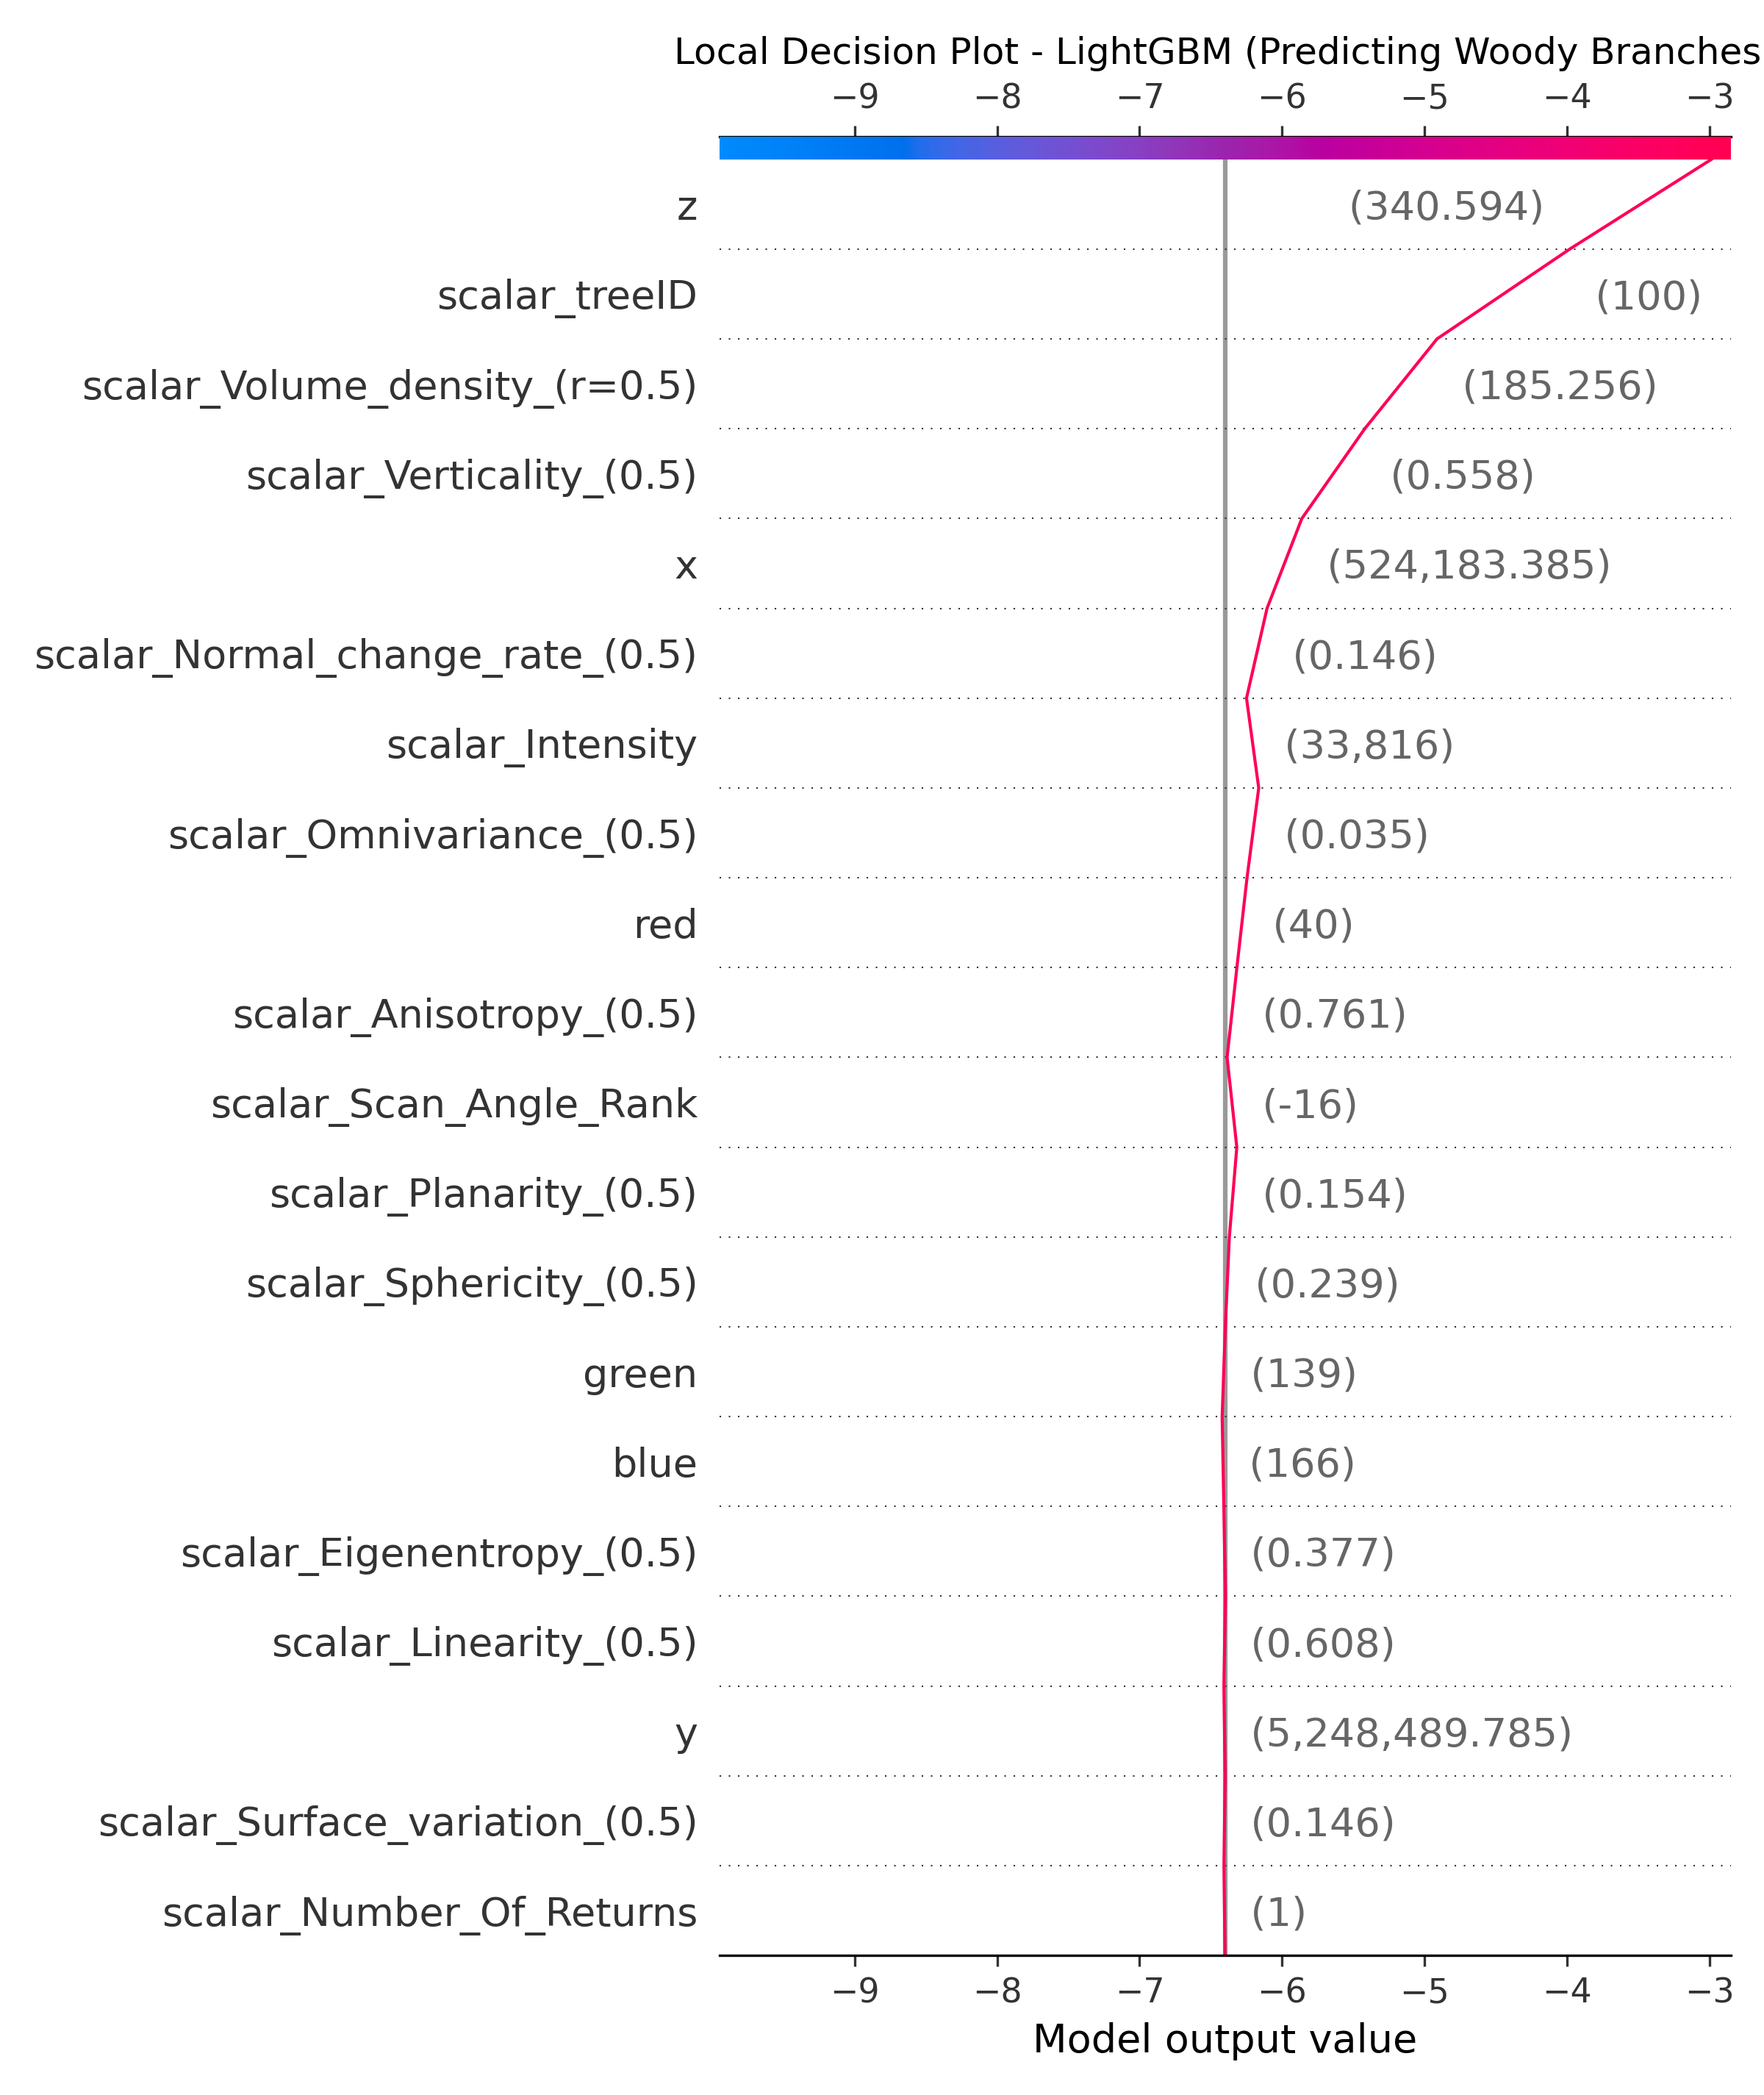
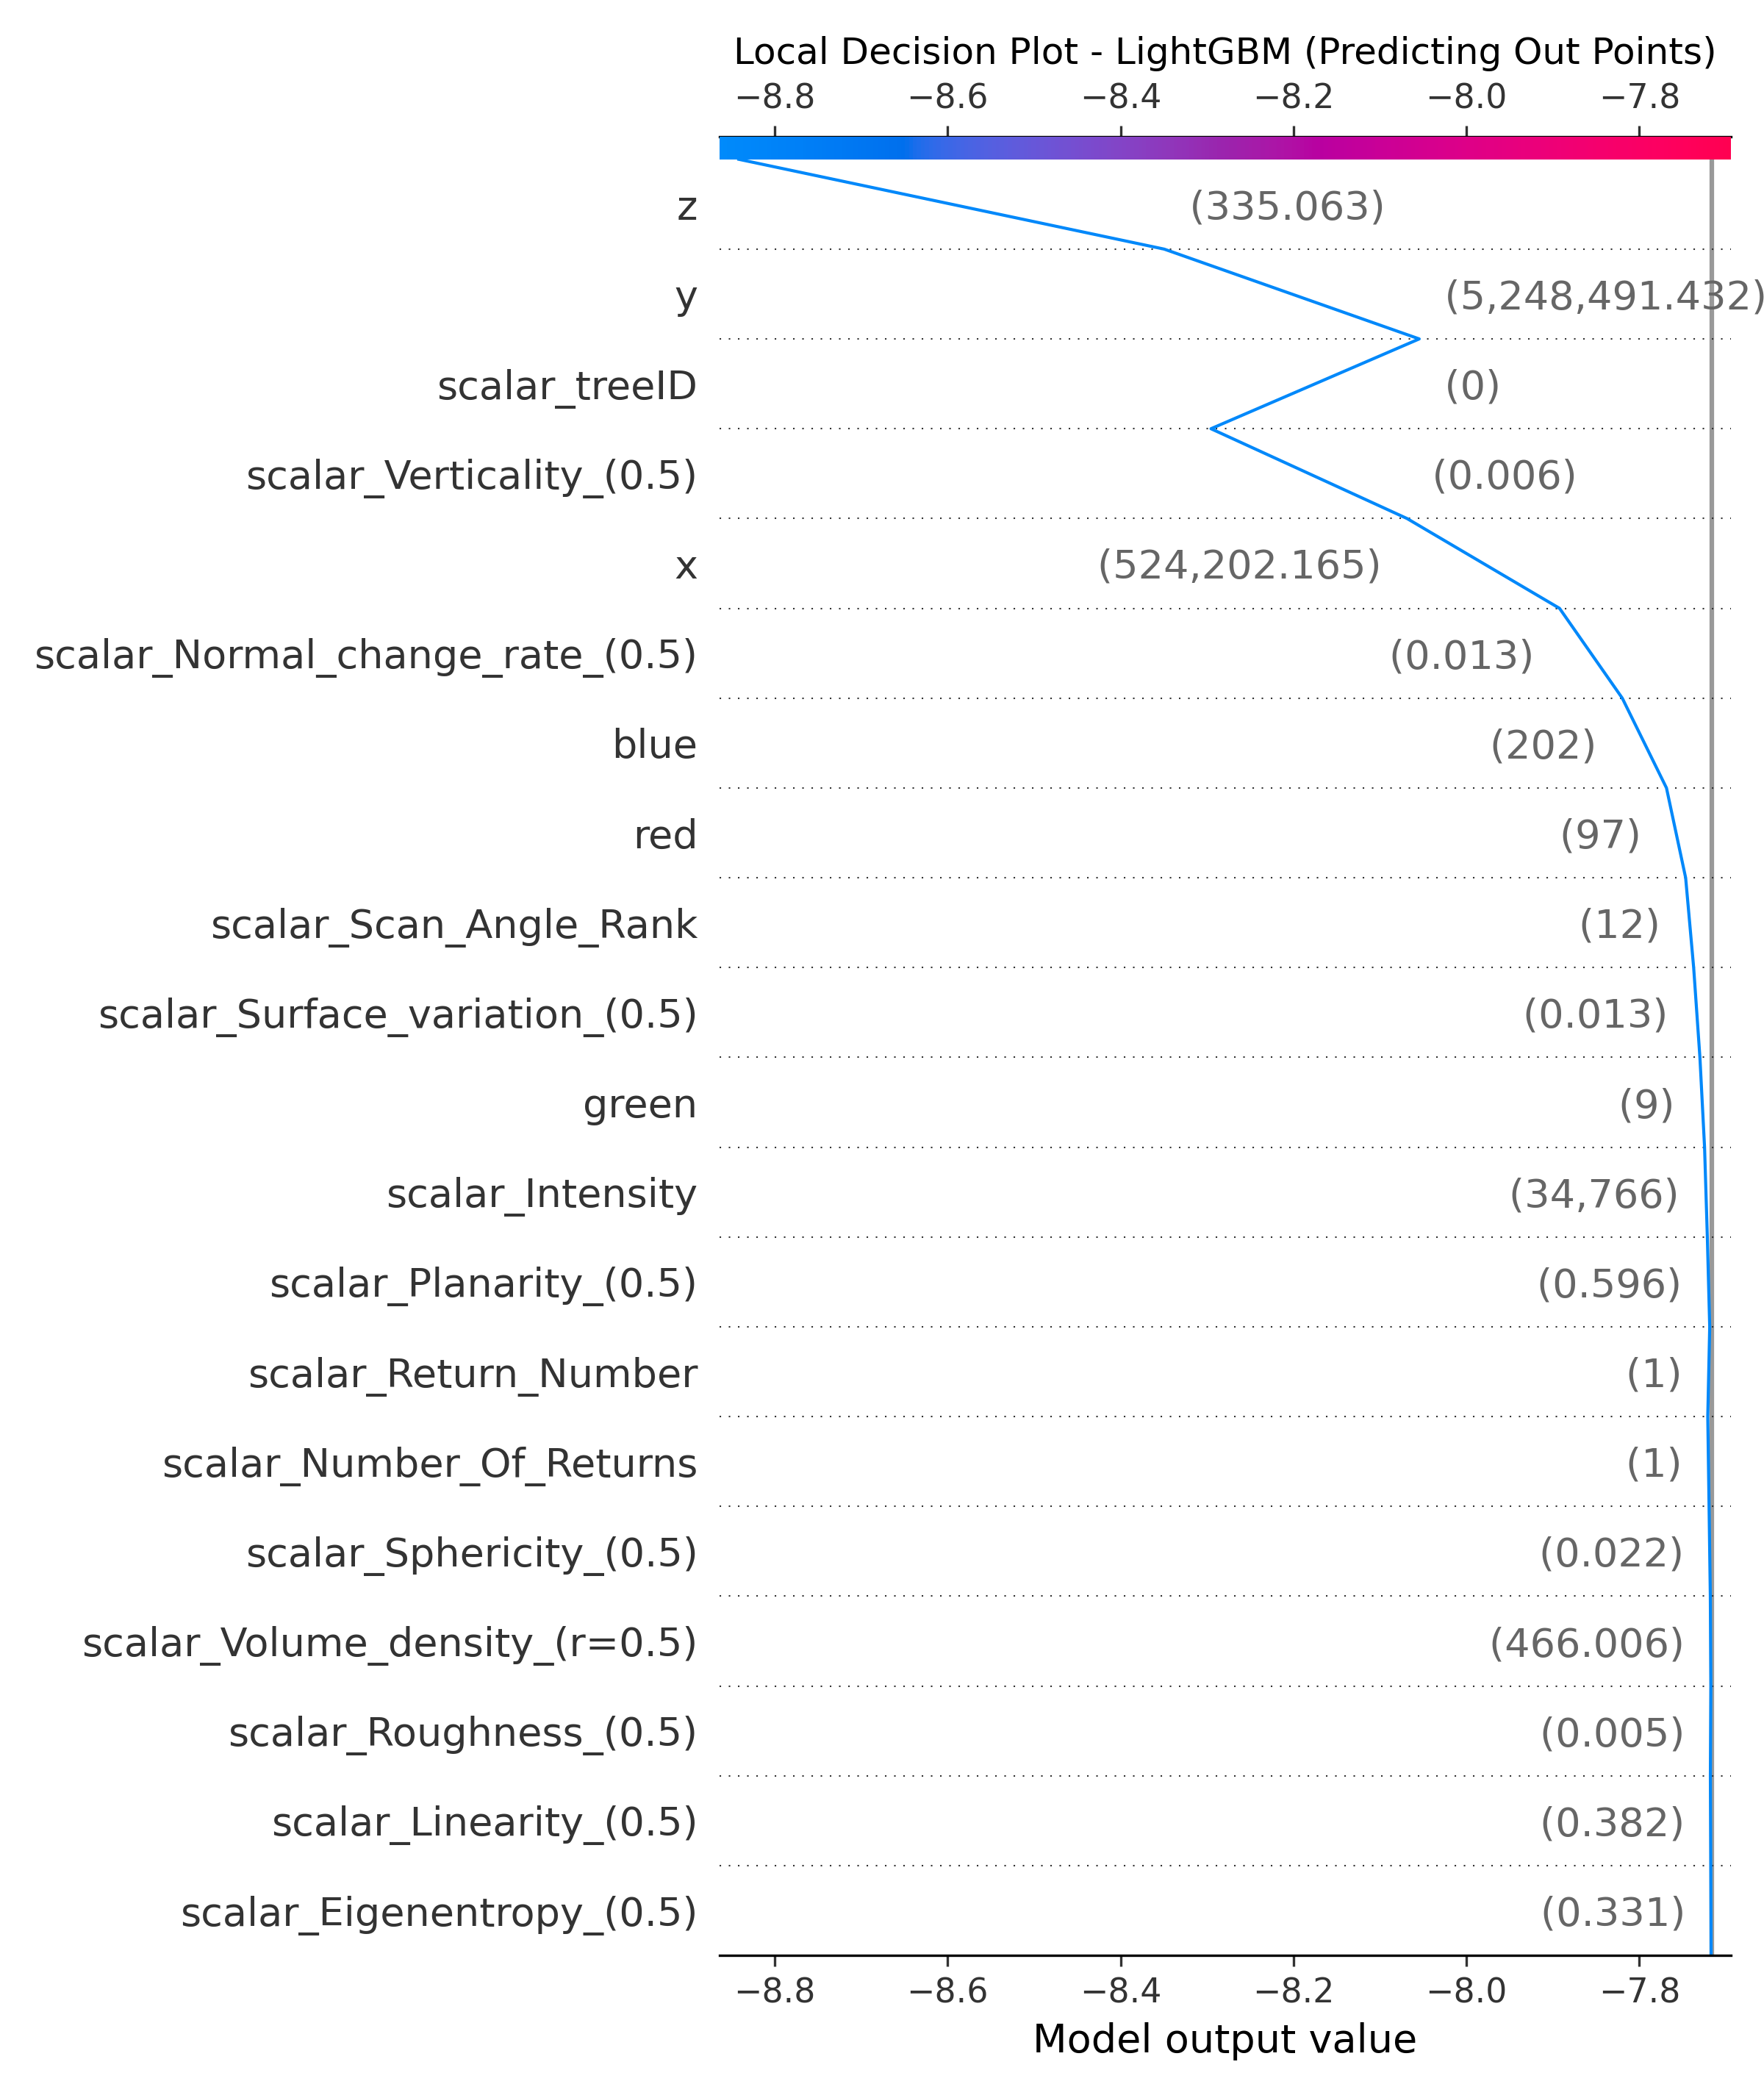
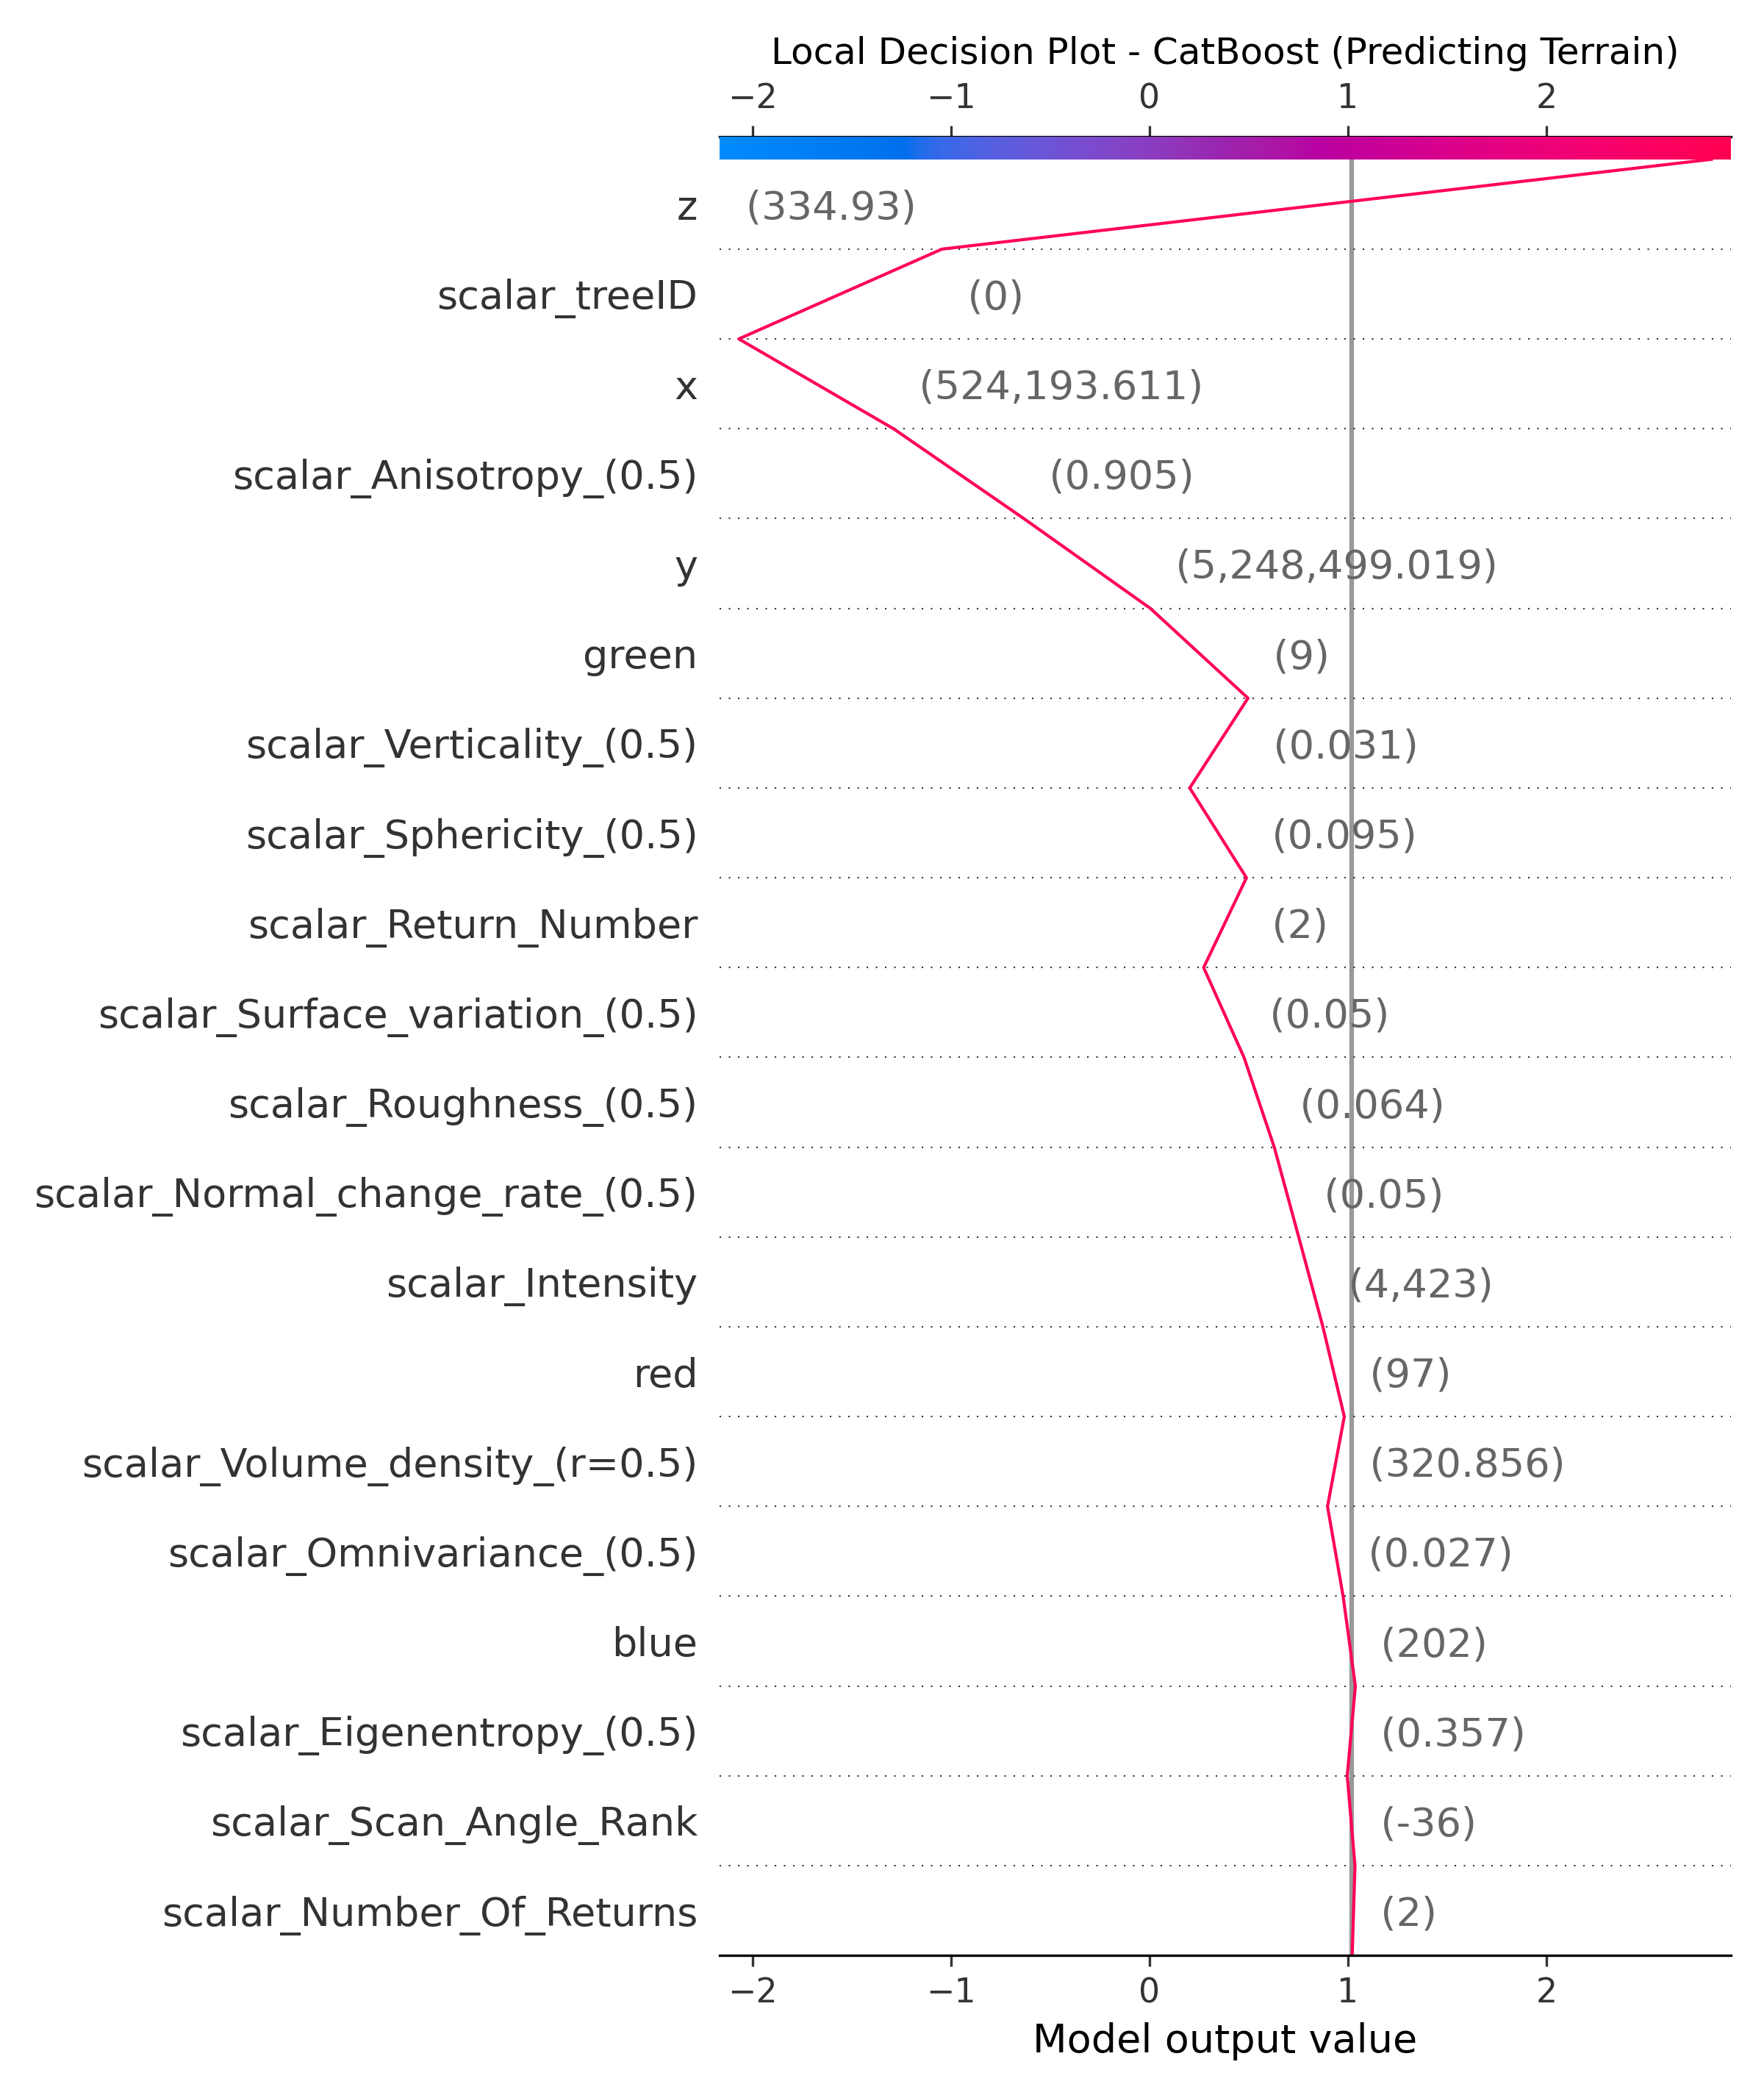
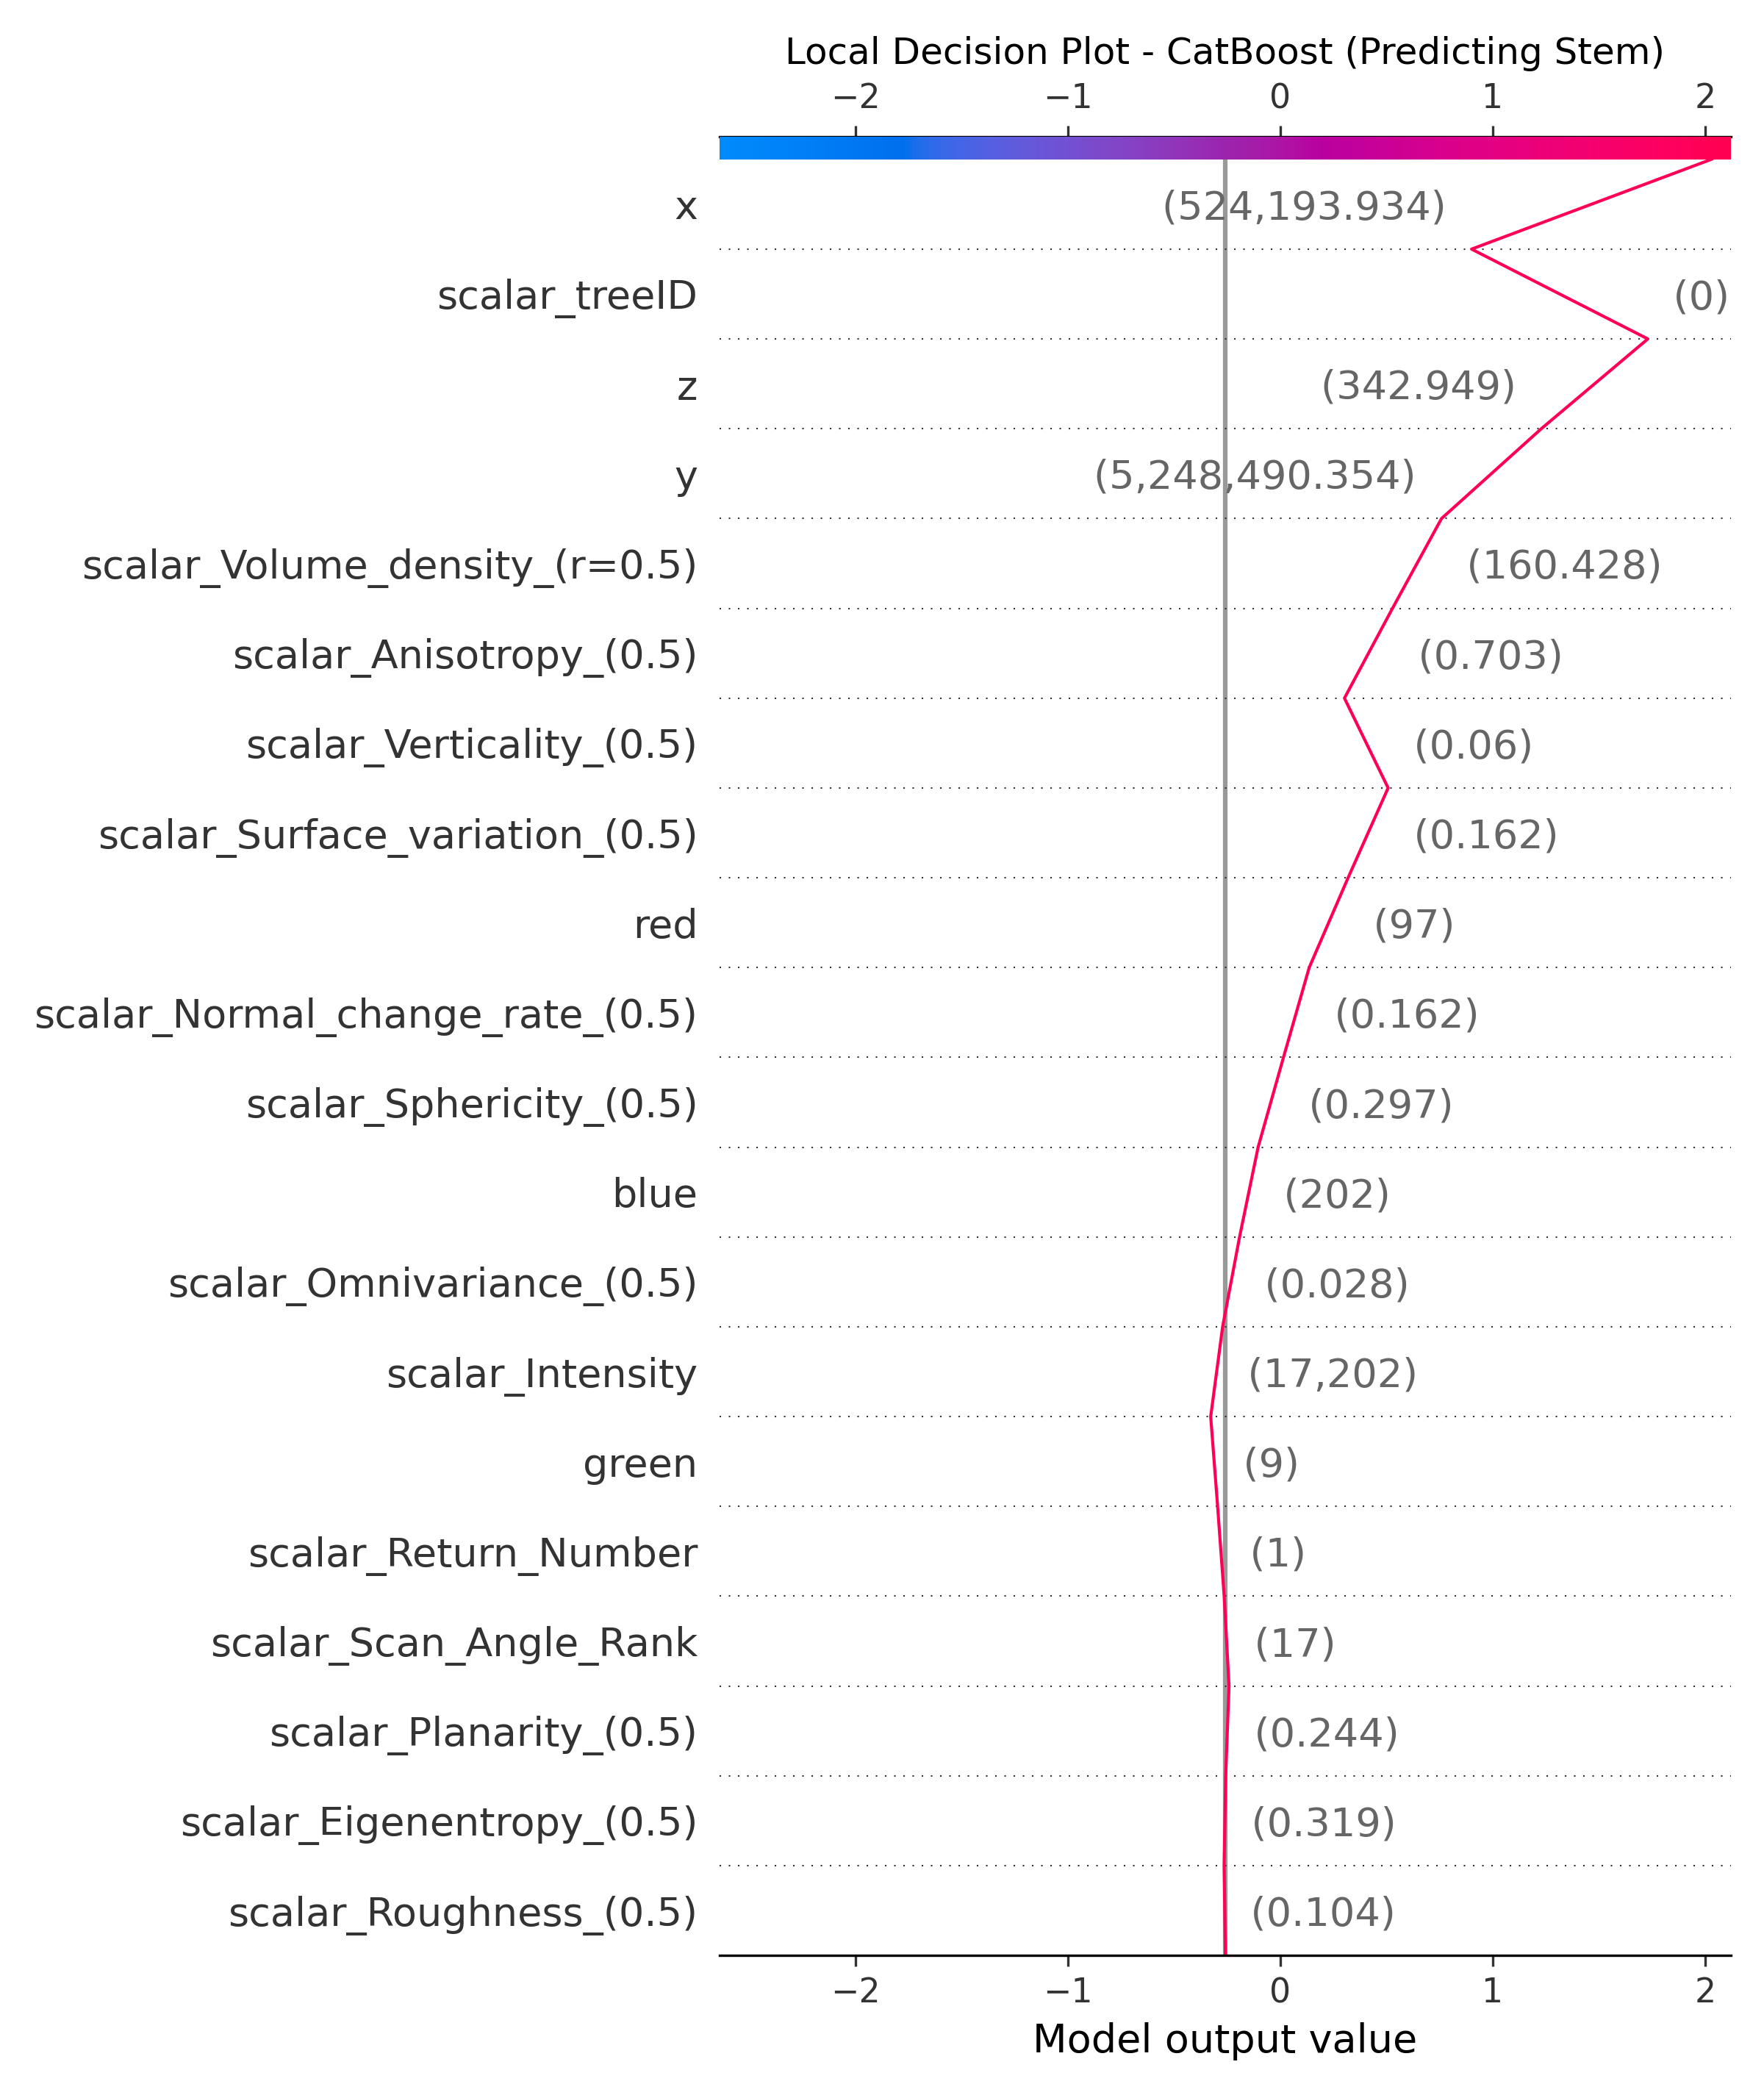
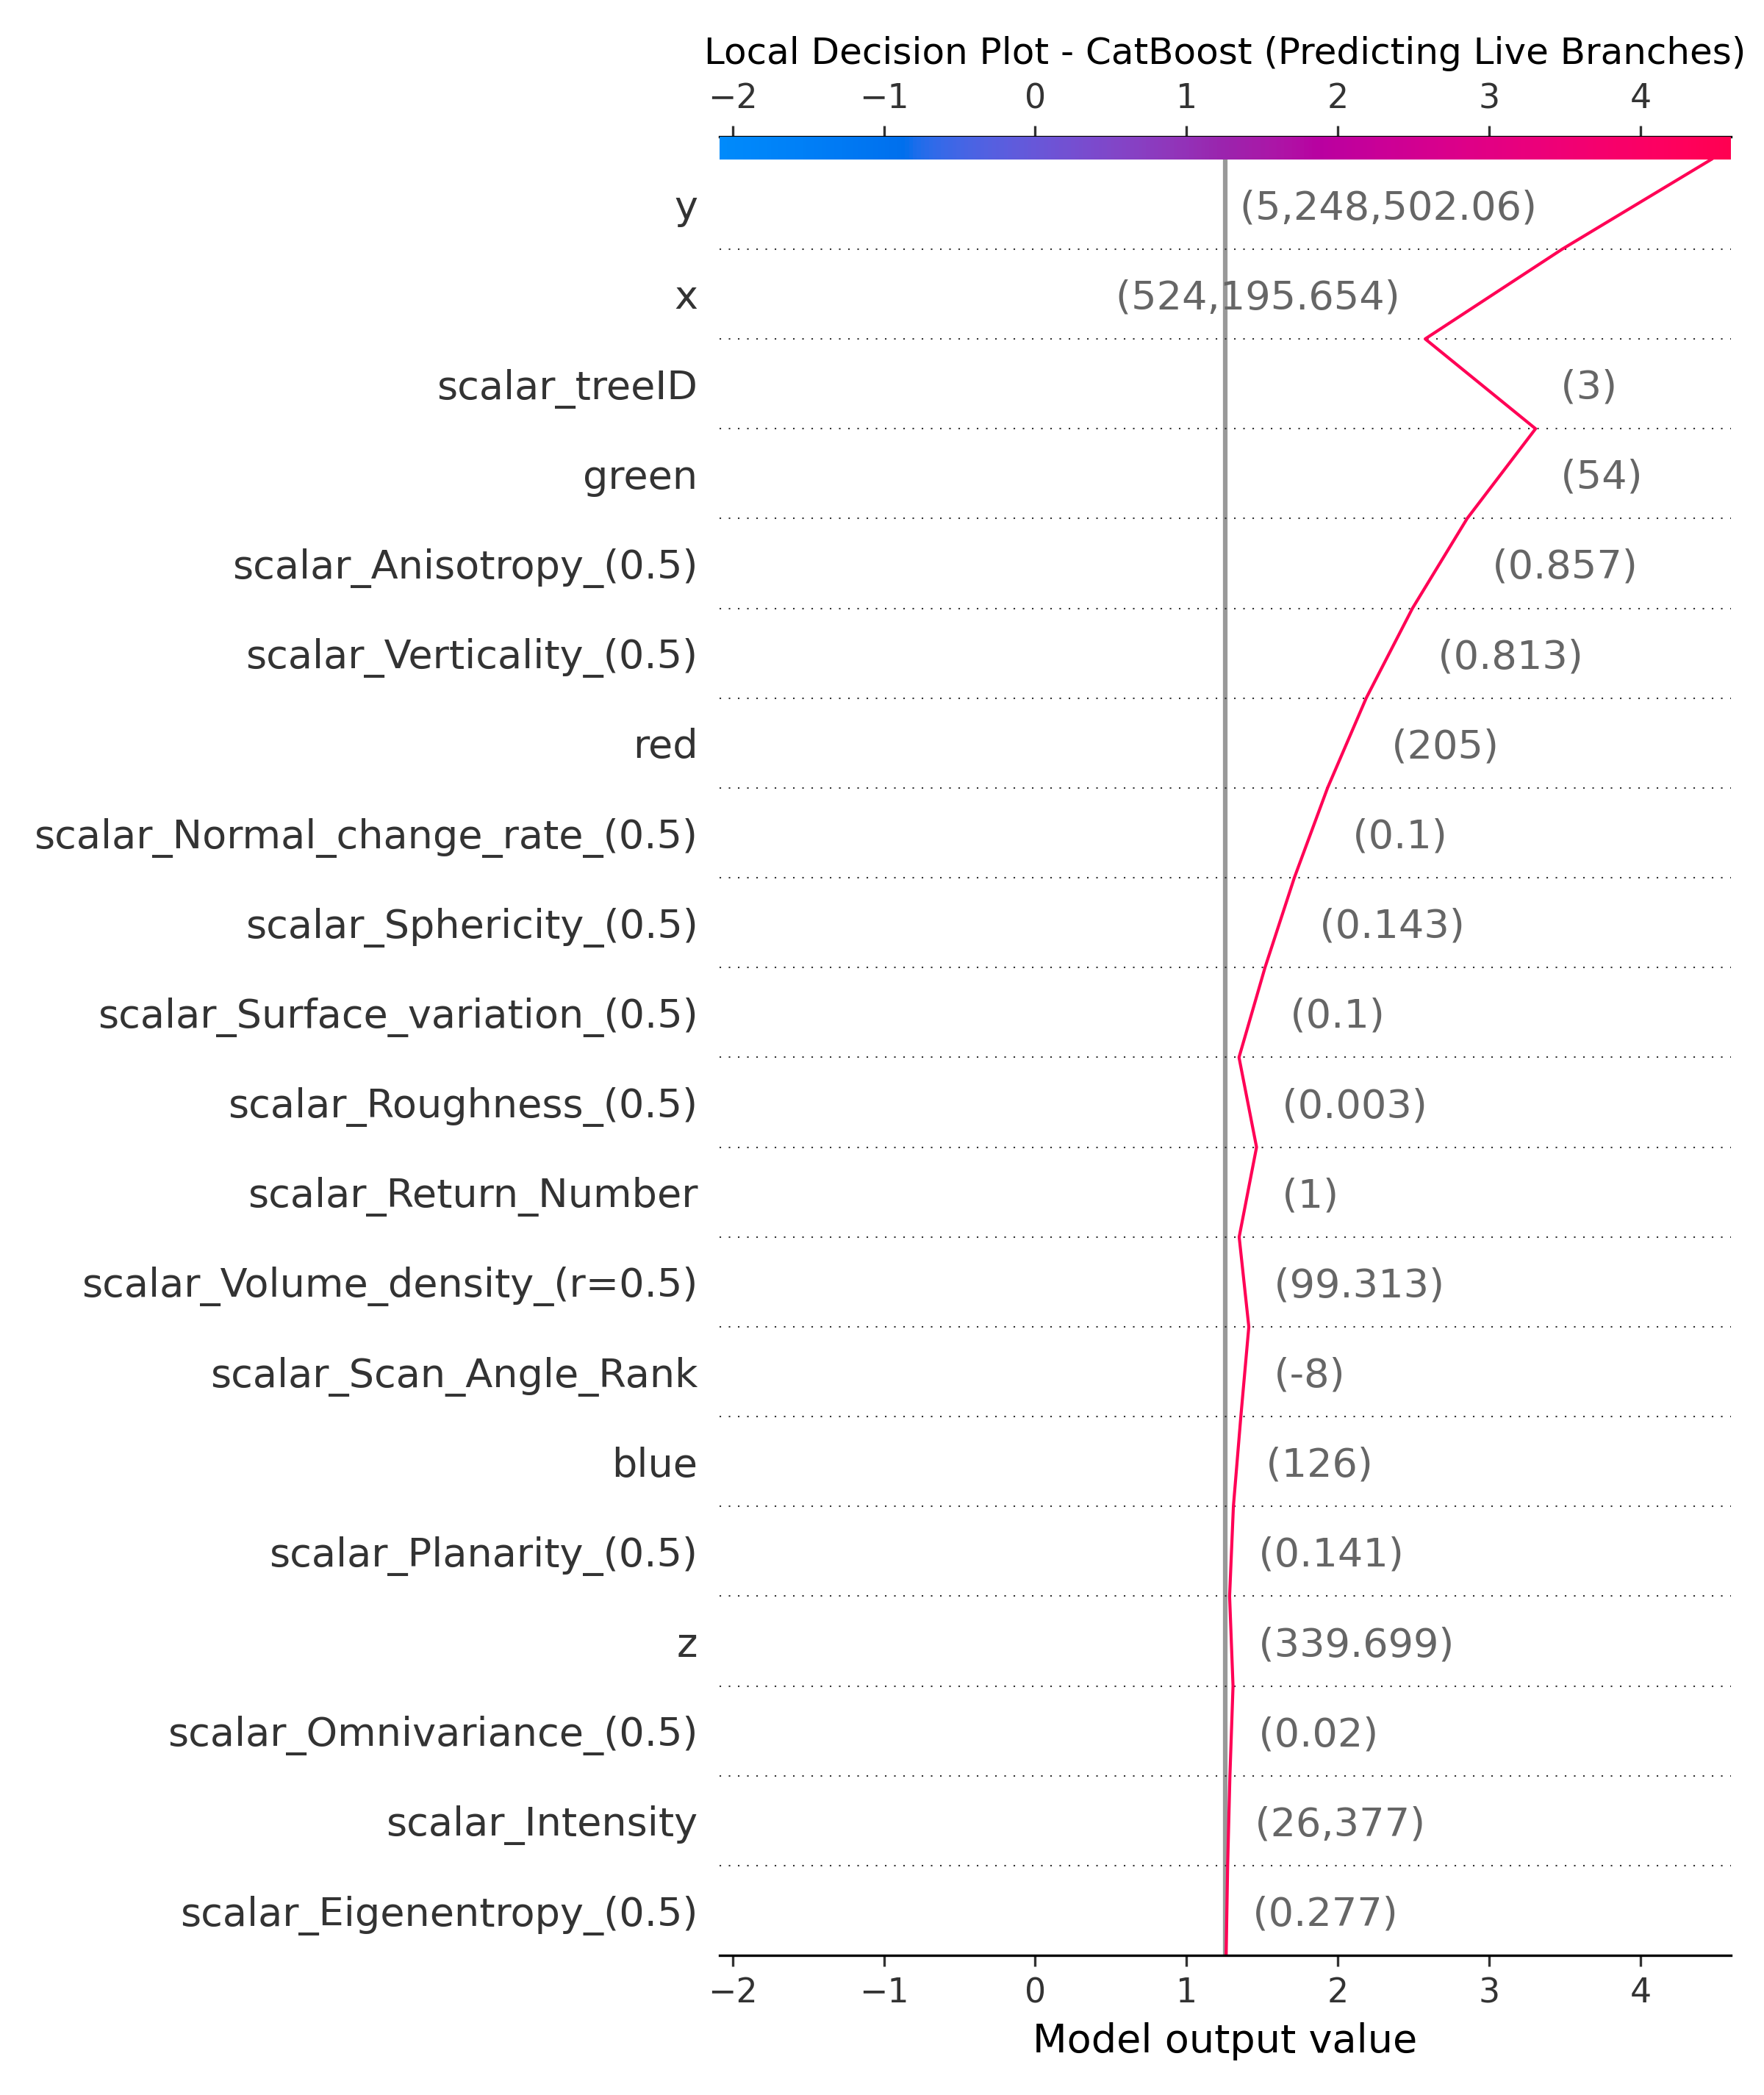
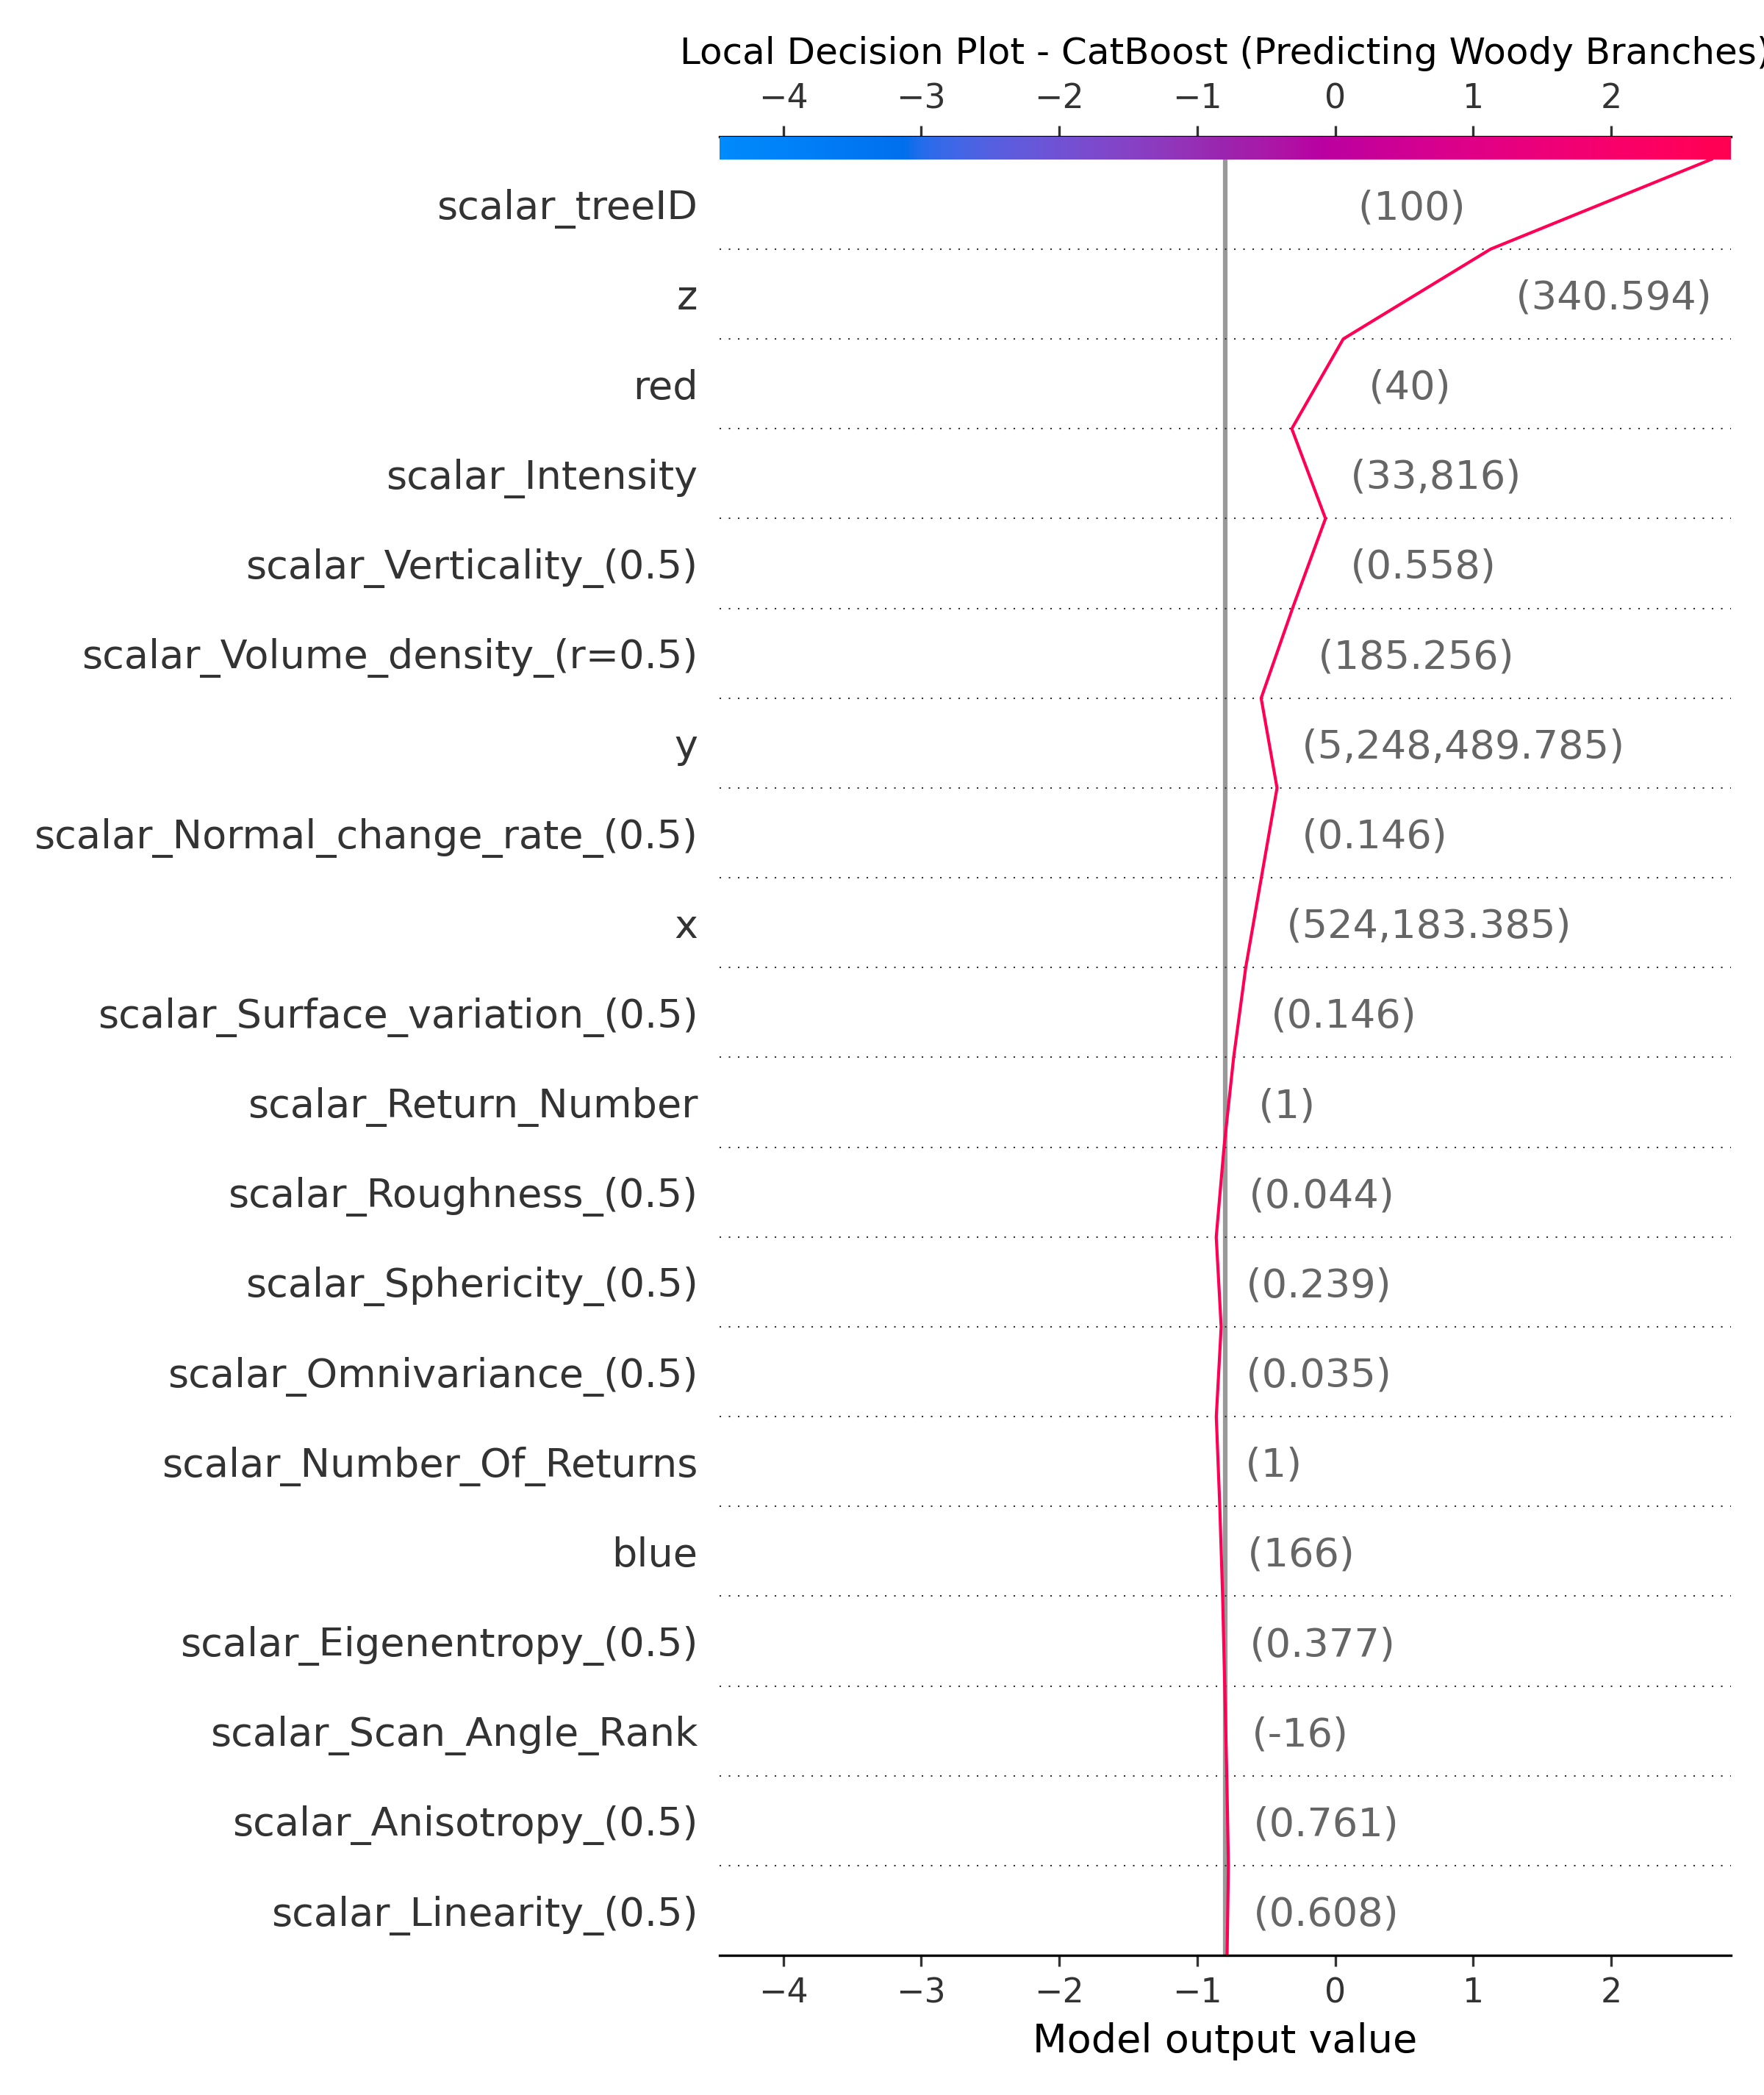
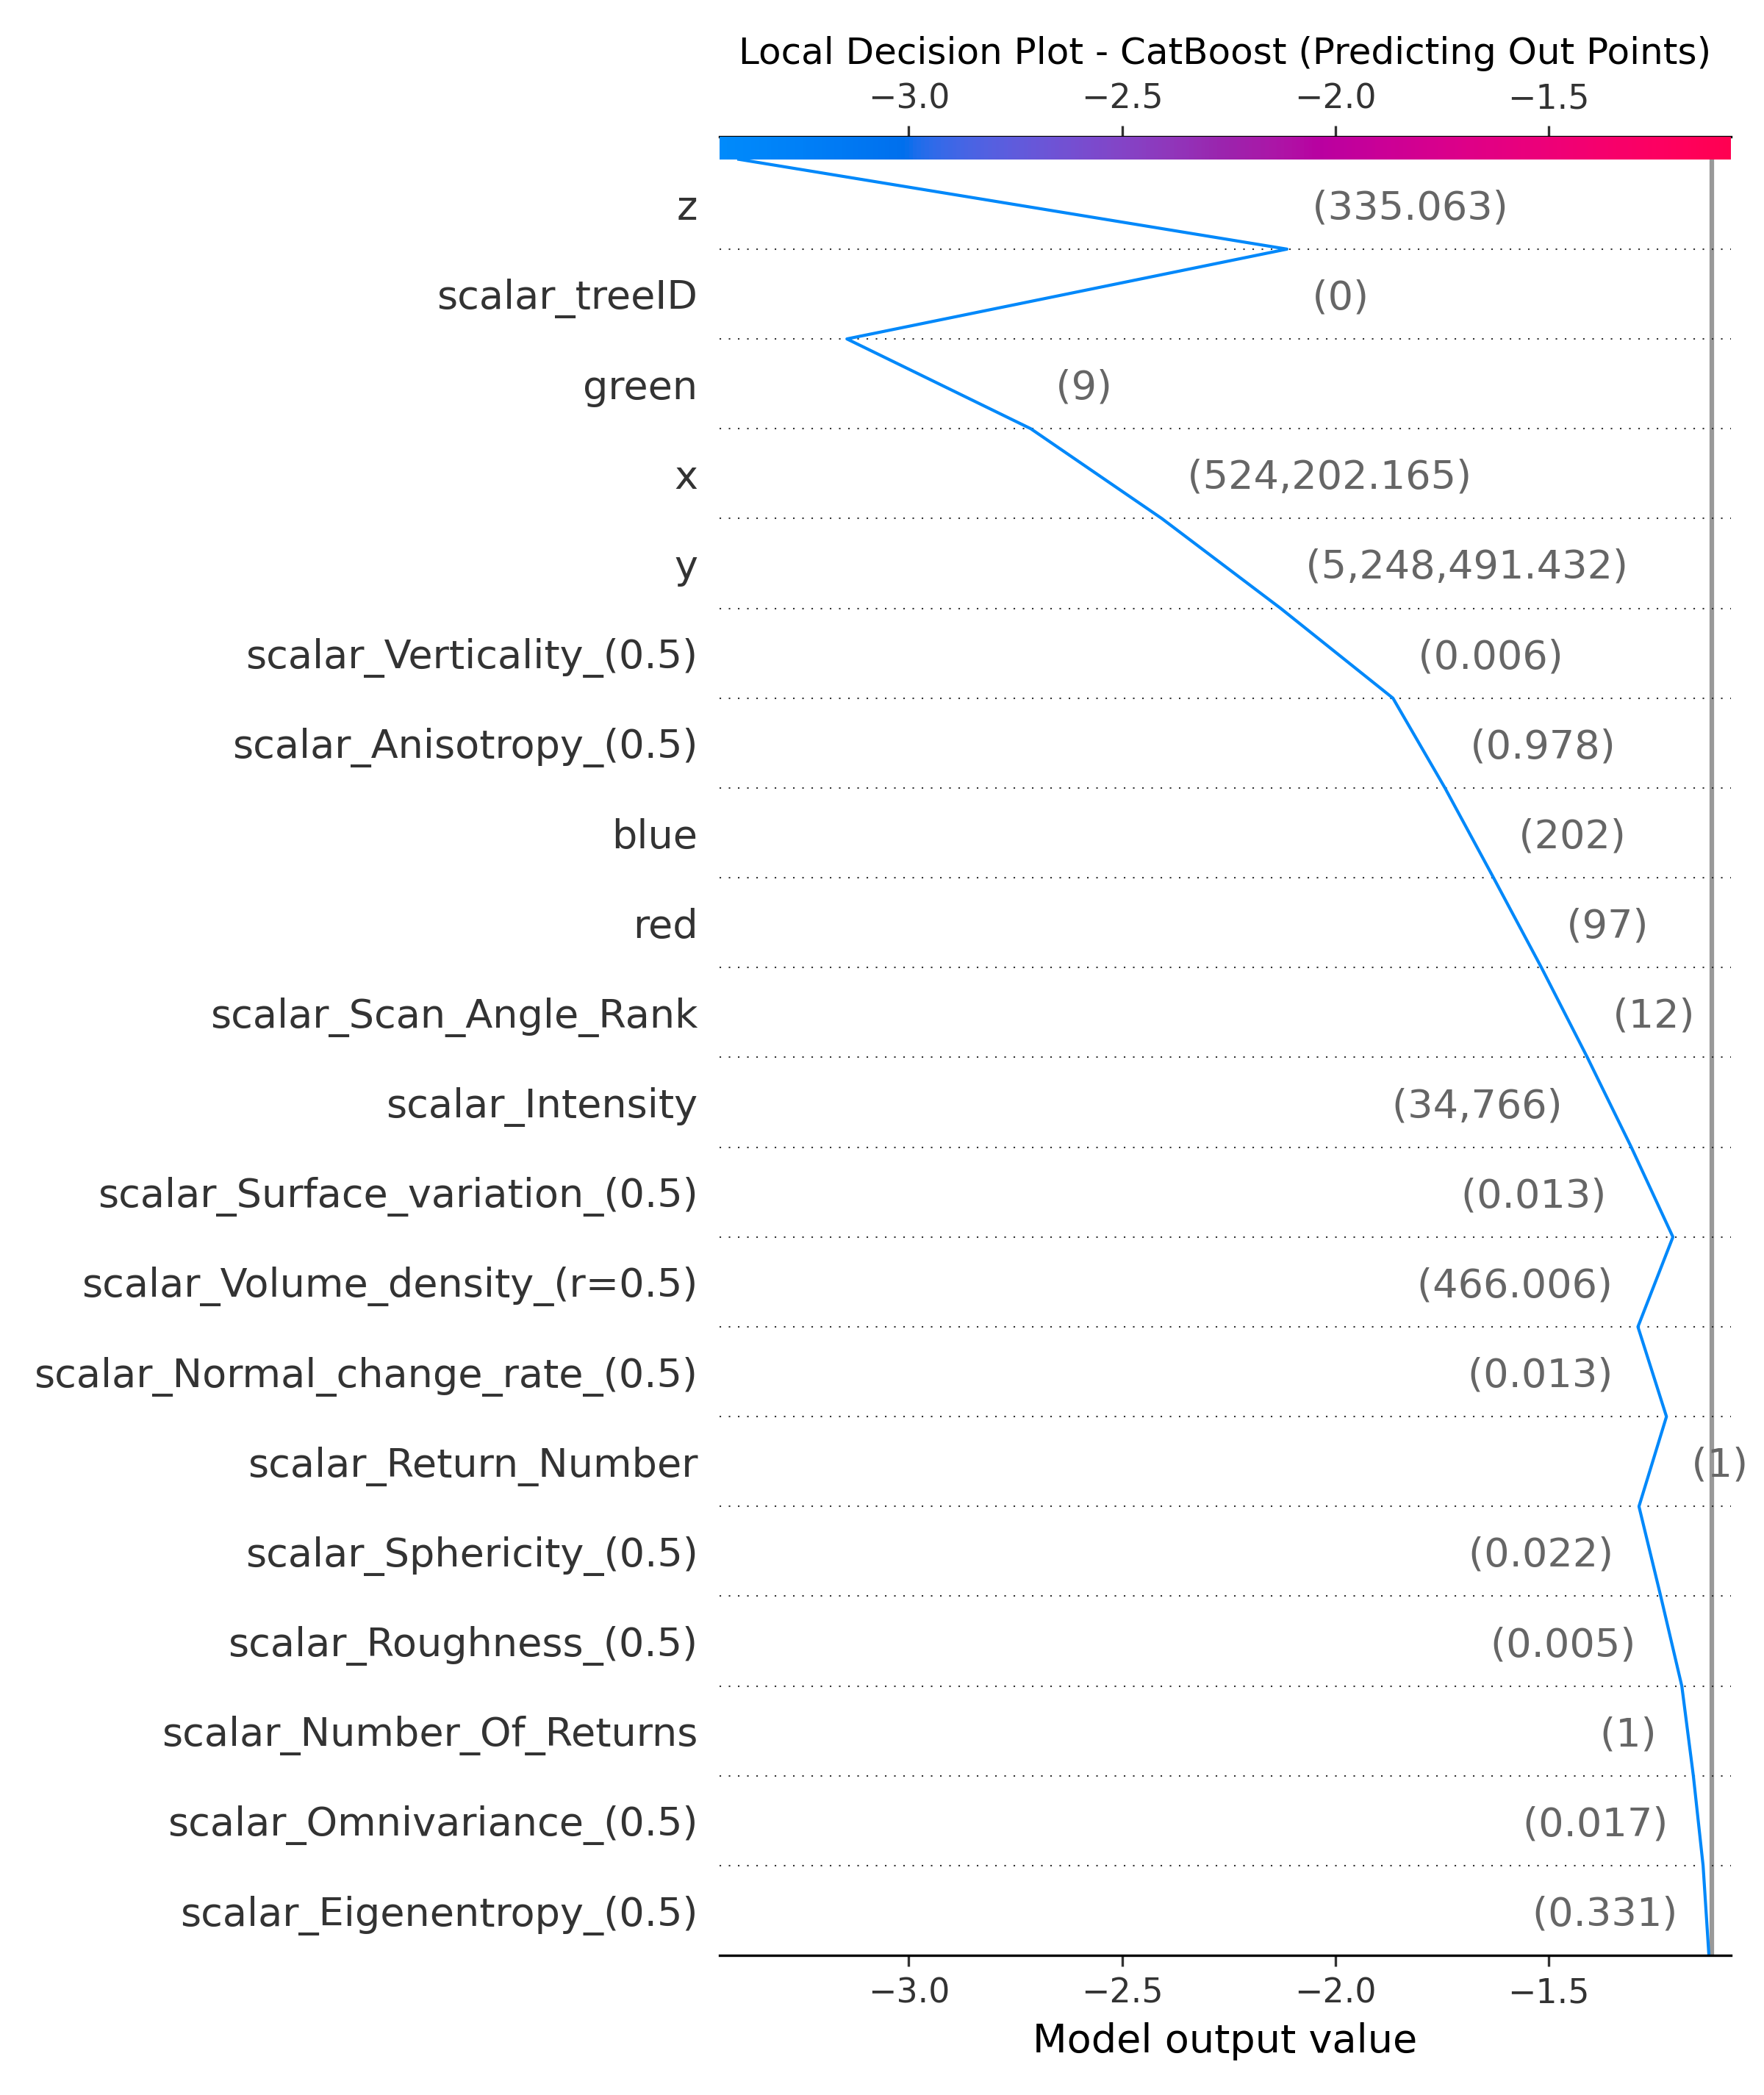
Local SHAP analysis breaks down each feature's contribution to the prediction for a particular instance. A point from a specific class is selected and Local SHAP decision values for each geometric feature are calculated to see exactly how the model reached its conclusion.
a. XGBoost Local Interpretation
b. LightGBM Local Prediction
c. CatBoost Local Prediction
VI. Conclusion
This study explored the effectiveness of geometric features in point cloud semantic segmentation using Explainable Artificial Intelligence (XAI), specifically SHAP. Three machine learning algorithms (XGBoost, LightGBM, and CatBoost) were used to assess performance and interpret predictions.
The SHAP analysis demonstrates the critical role of the z feature (height) in influencing the model's predictions across all classes for both global and local analysis. Verticality, Volume density, and Normal change rate also had significant impacts. The study highlights that high-accuracy point cloud classification and robust interpretability can be achieved by integrating XAI.