Introduction
Laboratory mice play a central role in biomedical research, making reliable assessment of their well-being essential for both animal welfare and scientific practice. Ethical frameworks such as the 3Rs (replace, reduce, refine) encourage methods that improve welfare monitoring while reducing burden on animals and experimenters.
The Mouse Grimace Scale (MGS) provides a standardized approach to assess pain and discomfort from facial action units. However, manual scoring requires trained experts, is time-consuming, and can introduce observer variability, limiting large-scale application.
Computer vision offers a path toward objective and scalable assessment. Previous work suggested that the muzzle contains visual cues related to the well-being status of mice. This raises a concrete question:
Can mouse well-being be classified accurately from images, and how much information is retained when using muzzle crops alone?
In this work, we addressed that question with a controlled ablation study. We built binary labels from available MGS scores, prepared paired muzzle-crop and full-image inputs for the same samples, and fine-tuned ImageNet-pretrained ResNet18 and ConvNeXt-Tiny across 14 experimental configurations.
Related Work
The Mouse Grimace Scale, introduced by Langford et al. (2010), scores facial action units such as orbital tightening, nose bulge, cheek bulge, ear position, and whisker change on a 0/1/2 scale. Although MGS is widely used, it depends on human raters.
DeepLabCut demonstrated that transfer learning with convolutional networks enables accurate markerless pose estimation for user-defined animal body parts. Andresen et al. (2026) studied automatic pain-face analysis in mice under non-standardized conditions. Dolensek et al. (2020) showed that mice express emotion-specific facial configurations with corresponding neural correlates, indicating that facial appearance encodes rich internal state information.
Most directly related, Reimann et al. (2026) compared computer-vision paradigms with human MGS assessment and reported indications that muzzle shape reflects well-being. Our work follows this motivation but focuses on a practical binary task and a transparent ablation of input type (crop vs. full), architecture (ResNet18 vs. ConvNeXt-Tiny), and training choices.
Method
We formulated mouse well-being assessment as a binary image classification task. Starting from Mouse Grimace Scale (MGS) annotations, image-level binary labels were constructed and paired with corresponding facial images.
To investigate whether the muzzle region alone provides sufficient information for well-being assessment, two image representations were considered:
- Muzzle crops — containing only the muzzle region.
- Full-face images — containing the original facial image.
Both representations correspond to the same image identities and share identical labels and dataset splits, enabling a direct comparison between localized and complete facial information.
Label Construction
For each image, the available expert scores were combined into a single image-level score by averaging all valid facial action unit scores. Binary labels were then assigned with a threshold of 0.5: images with an average score ≥ 0.5 were labeled as impaired, and those below as not impaired.
Image Preparation
All images were converted to RGB, resized to 224 × 224 pixels using bilinear interpolation, scaled to [0, 1], and normalized using the ImageNet channel-wise mean and standard deviation.
Dataset
The experiments were based on the Mouse Grimace Faces dataset, which contains approximately 35,000 facial images collected from five experimental subsets. Since our objective was binary classification rather than regression, images without valid annotations were excluded. After filtering and label construction, the curated dataset contained 1,778 images with a balanced distribution of impaired and not-impaired samples.
| Subset | Train | Val | Test | Total |
|---|---|---|---|---|
| AW | 62 (37/25) | 13 (8/5) | 13 (8/5) | 88 |
| JW | 262 (105/157) | 56 (23/33) | 56 (23/33) | 374 |
| KH | 362 (156/206) | 77 (33/44) | 77 (33/44) | 516 |
| LW | 158 (133/25) | 34 (29/5) | 34 (29/5) | 226 |
| MR | 402 (190/212) | 86 (41/45) | 86 (41/45) | 574 |
| Total | 1,246 | 266 | 266 | 1,778 |
A fixed train/validation/test split of 70%/15%/15% was constructed, stratified by experimental subset and class, while preserving mouse identities to avoid information leakage between training and evaluation.
Model Architectures
Two convolutional neural network architectures were evaluated:
- ResNet18 — a residual network with skip connections, widely adopted in biomedical image classification.
- ConvNeXt-Tiny — a modernized convolutional architecture that incorporates design elements from vision transformers while retaining a pure convolutional structure.
Both models were initialized with ImageNet-pretrained weights and adapted for binary classification by replacing the final classification layer with a two-class prediction head. Unless otherwise stated, all network parameters were fine-tuned during training.
Training Strategy
The experiments were organized into two parts:
Part 1: Architecture, Image Representation, and Augmentation
The first group evaluated two architectures (ResNet18 and ConvNeXt-Tiny) using two image representations (muzzle crops and full-face images), each with either no augmentation or light augmentation. This factorial design yielded 8 experimental configurations.
Part 2: Targeted Hyperparameter Tuning
Based on the best configurations from Part 1, the second stage varied the learning rate, dropout probability, and backbone freezing strategy, yielding 6 additional configurations for a total of 14 experiments.
Training used categorical cross-entropy loss with the AdamW optimizer. Early stopping based on validation Macro-F1 was employed to reduce overfitting. A ReduceLROnPlateau scheduler decreased the learning rate when validation performance saturated.
Evaluation Metrics
Model performance was evaluated using Accuracy, Precision, Recall, Macro-F1 score, and ROC-AUC. Macro-F1 was the primary metric because it gives equal importance to both classes.
Part 1 Results
The table below summarizes the held-out performance of the eight baseline configurations:
| Model | Input | Aug. | Acc. | Macro-F1 | ROC-AUC |
|---|---|---|---|---|---|
| ResNet18 | full | light | 0.831 | 0.830 | 0.890 |
| ConvNeXt-Tiny | crop | light | 0.797 | 0.797 | 0.849 |
| ConvNeXt-Tiny | full | none | 0.797 | 0.797 | 0.851 |
| ConvNeXt-Tiny | full | light | 0.797 | 0.796 | 0.859 |
| ConvNeXt-Tiny | crop | none | 0.789 | 0.789 | 0.846 |
| ResNet18 | full | none | 0.774 | 0.773 | 0.838 |
| ResNet18 | crop | light | 0.759 | 0.759 | 0.852 |
| ResNet18 | crop | none | 0.737 | 0.737 | 0.820 |
Effect of augmentation: Light data augmentation consistently improved ResNet18 performance. For full-face images, Macro-F1 increased from 0.773 to 0.830 (+5.7 percentage points). ConvNeXt-Tiny was comparatively insensitive to augmentation, showing only marginal changes.
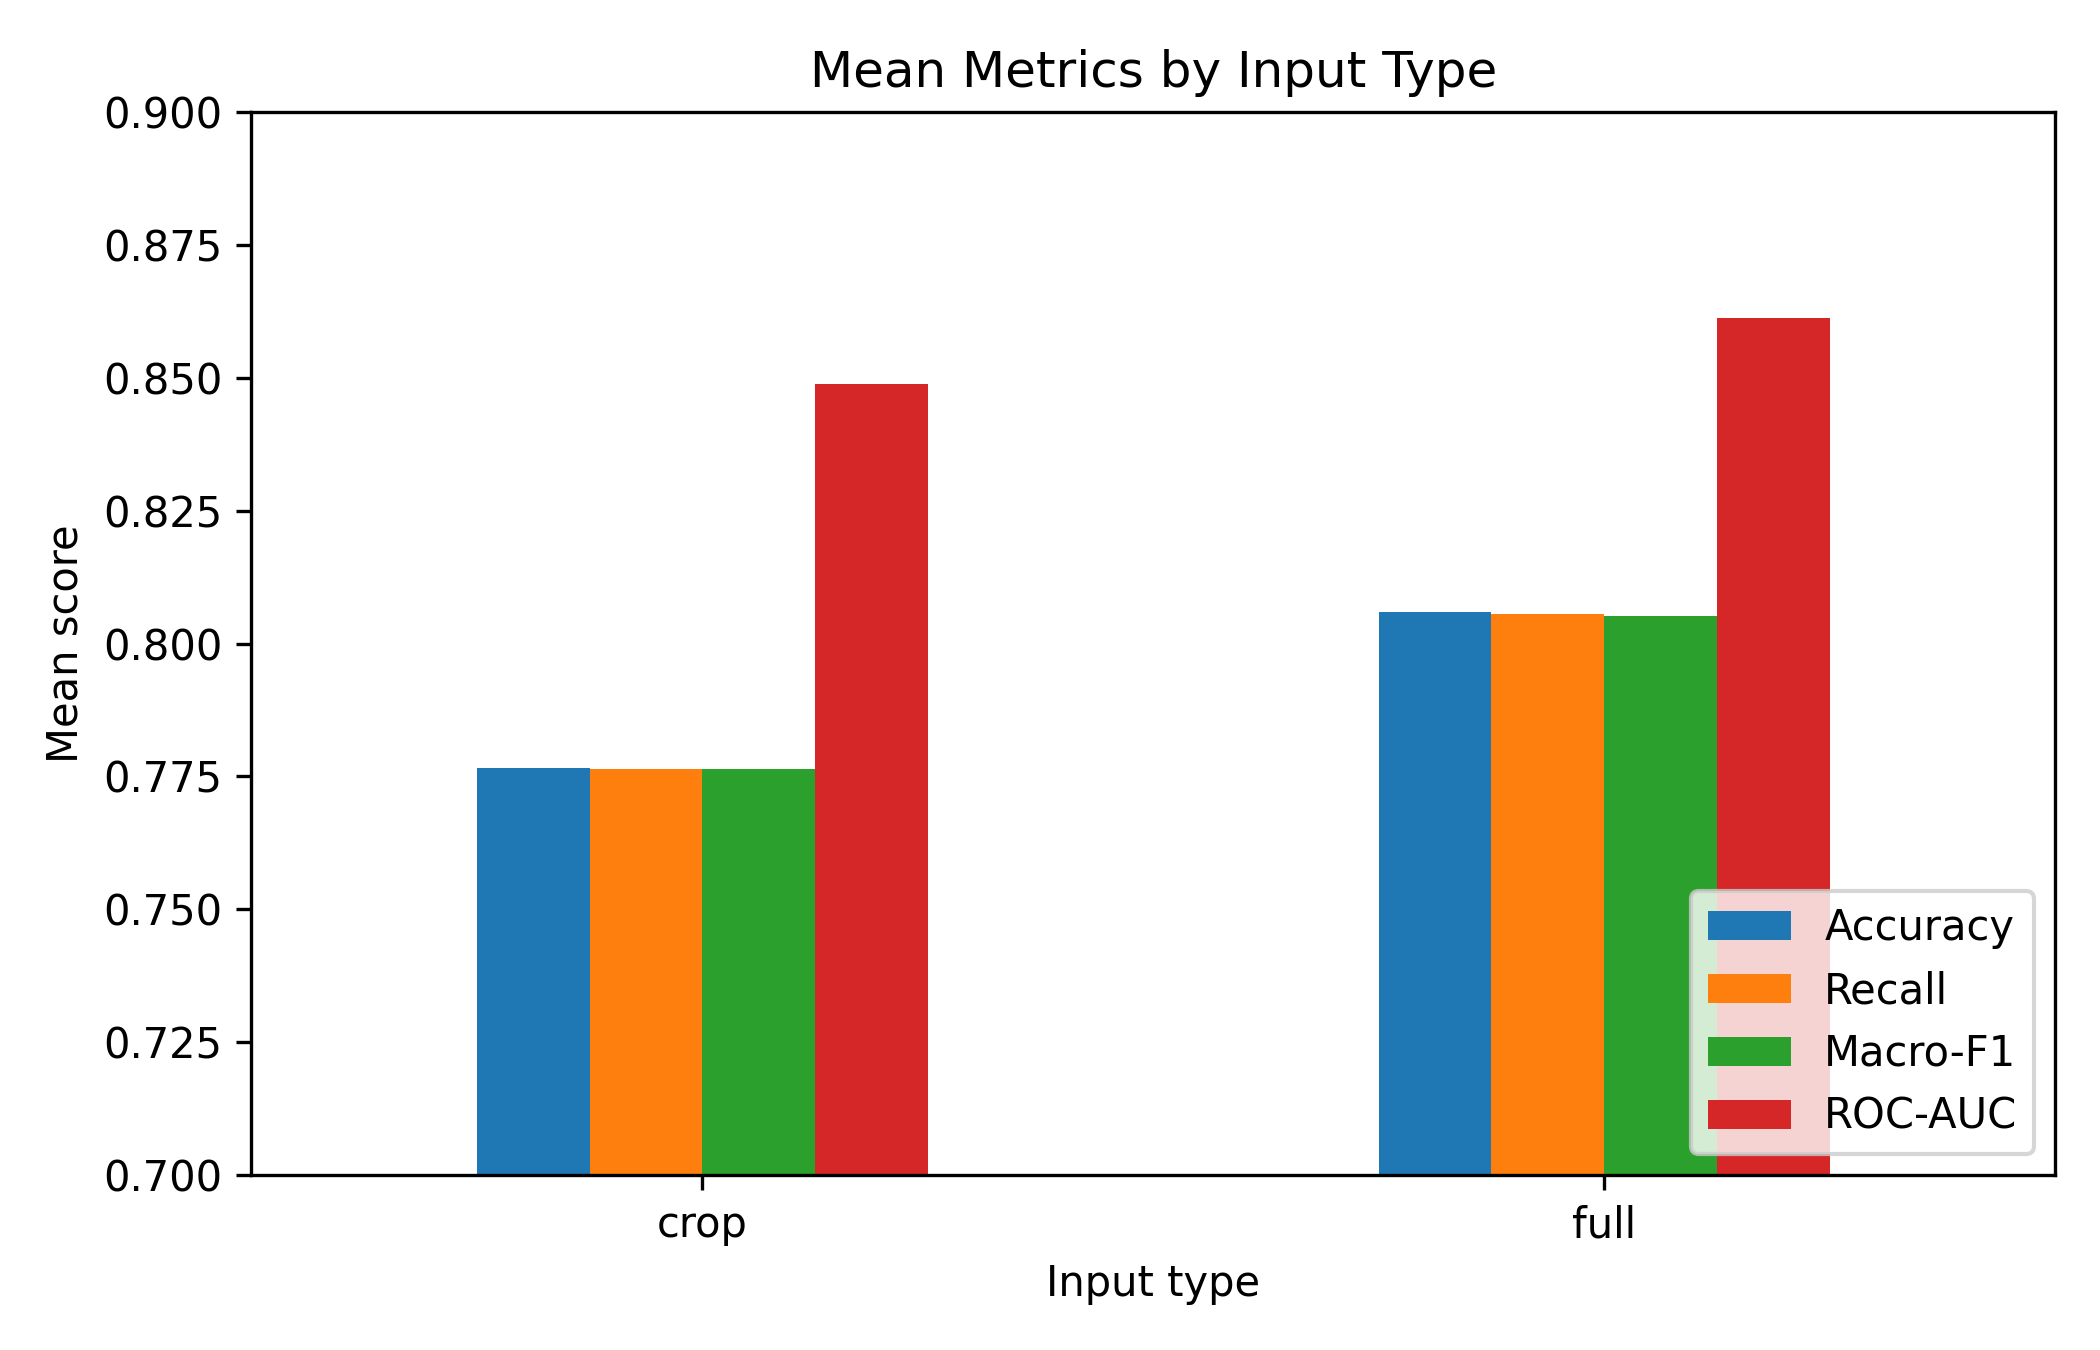
Effect of image representation: Across all baseline experiments, full-face images achieved a slightly higher average Macro-F1 (0.805) than muzzle crops (0.776). However, the performance gap remained relatively small, indicating that the muzzle preserves much of the visual information required for binary well-being classification.
Part 2 Results
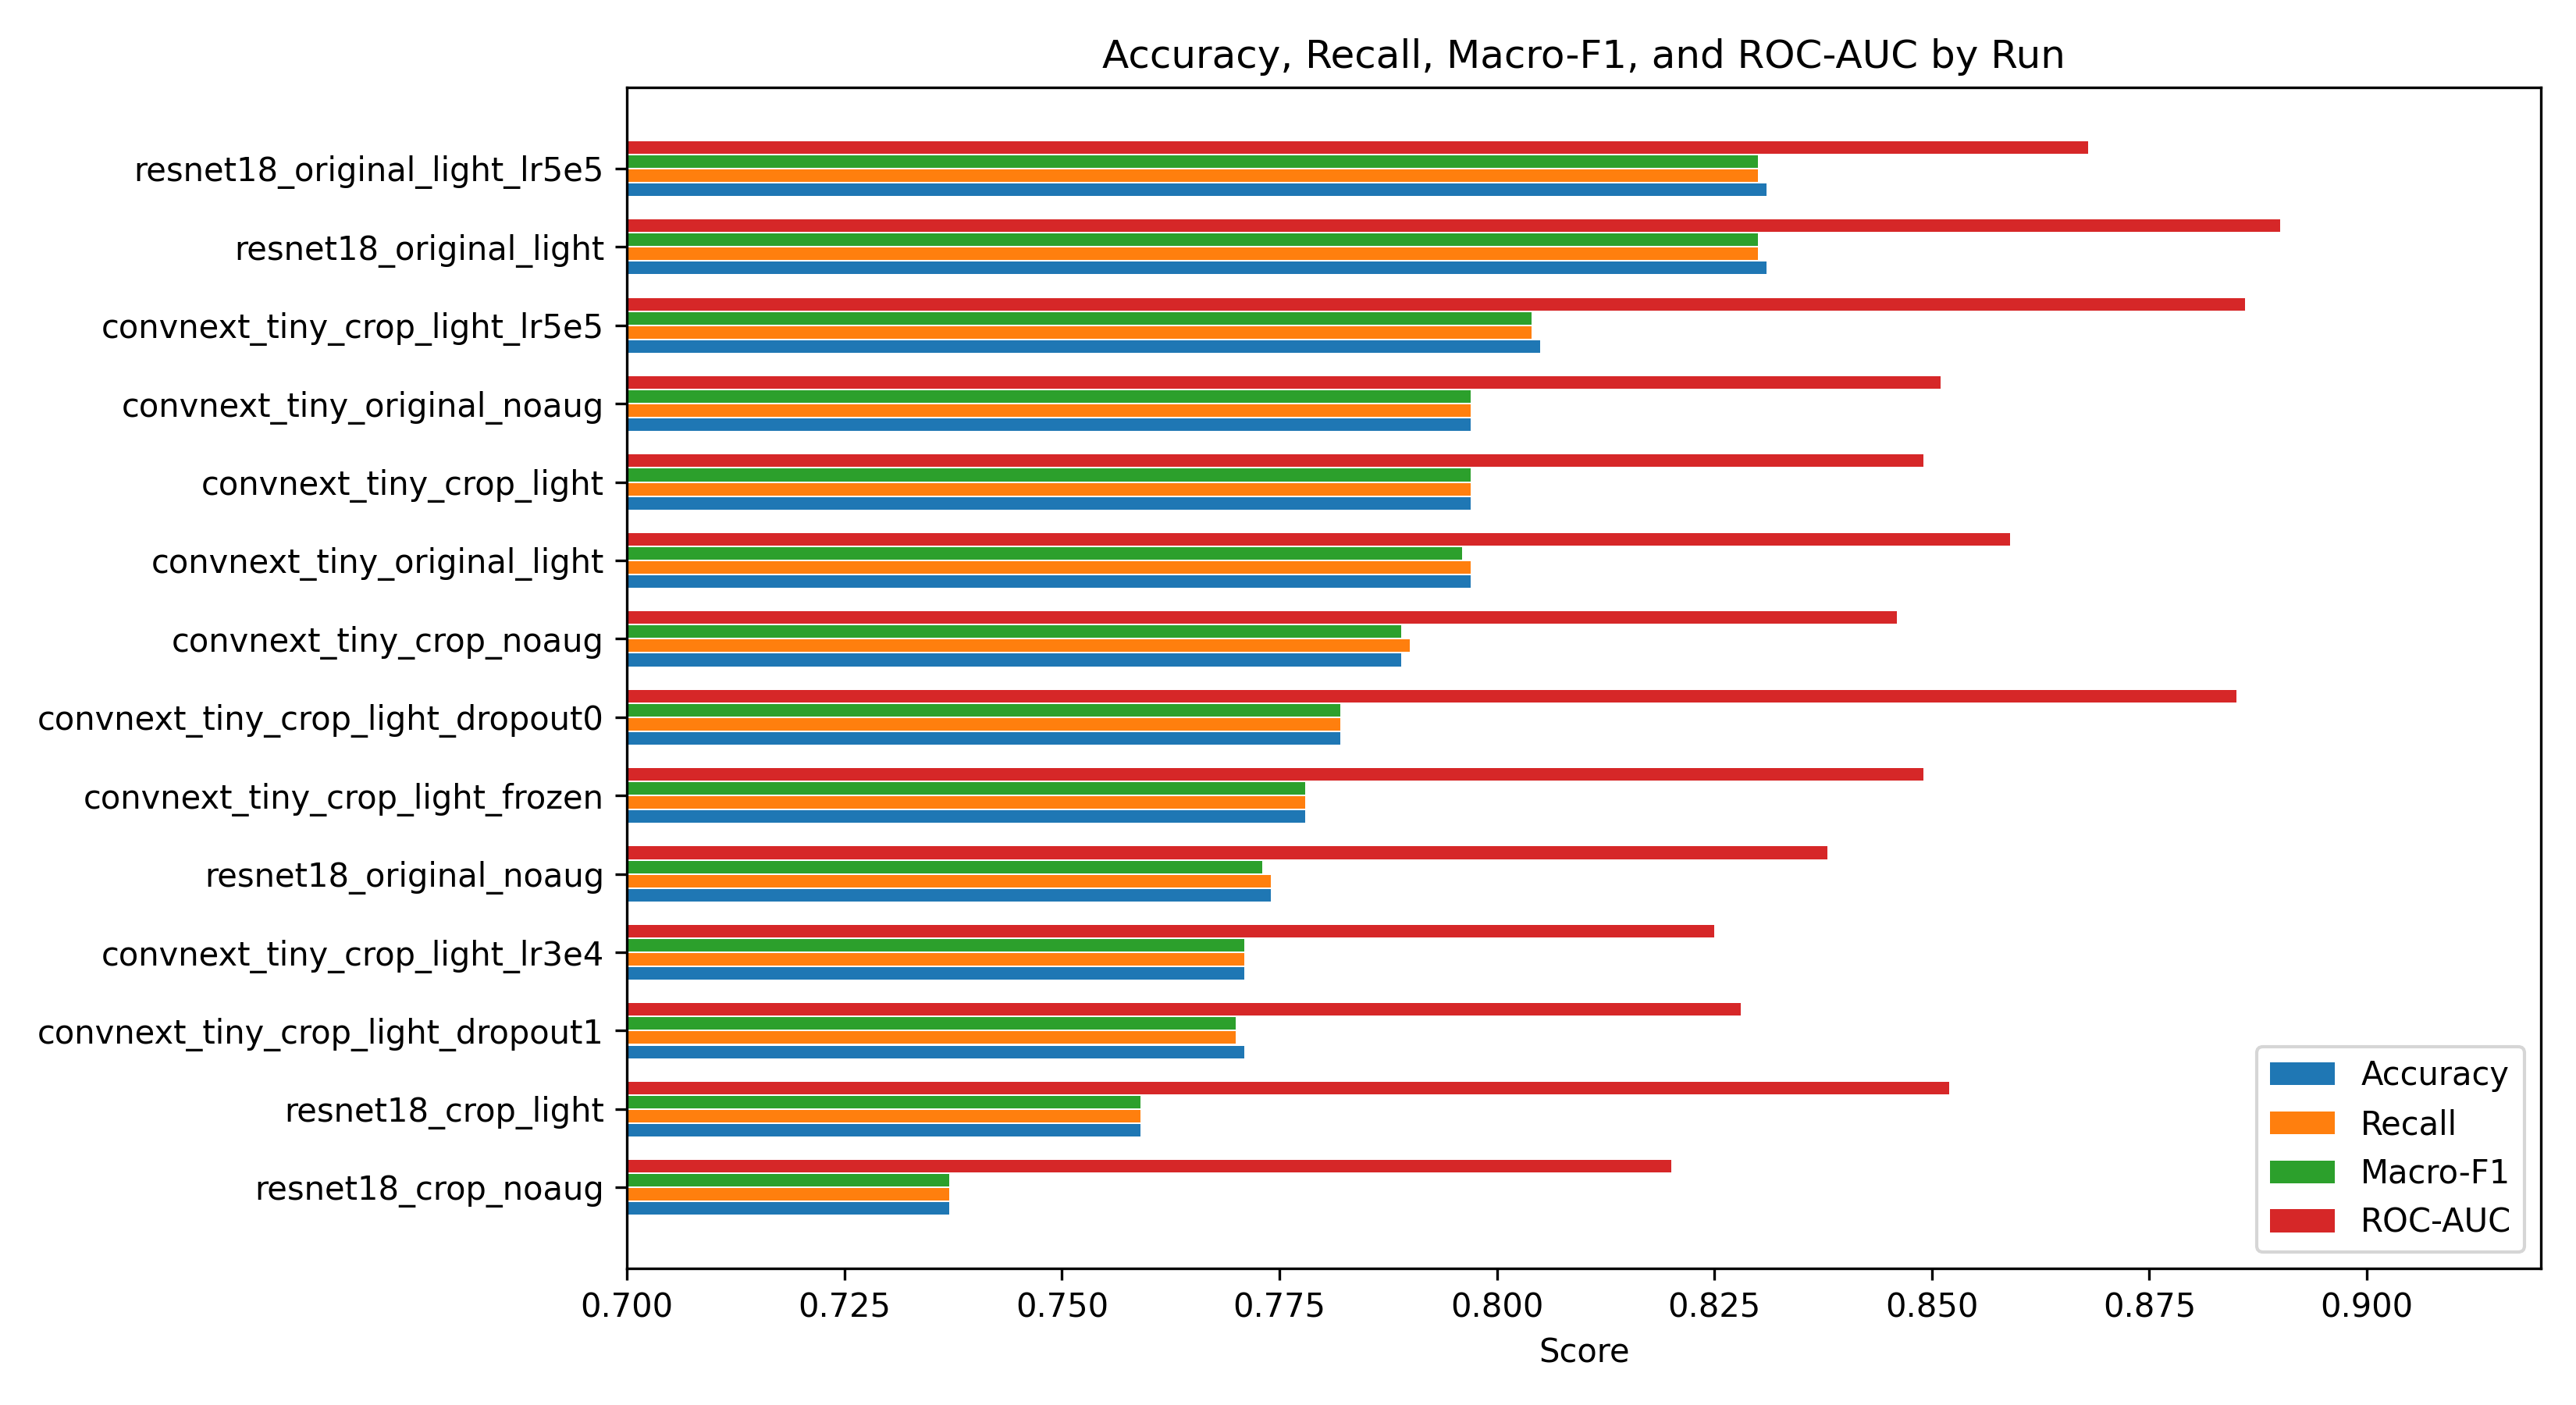
Based on the best Part 1 configurations, targeted hyperparameter tuning was performed. The key findings:
- Reducing the learning rate to 5×10⁻⁵ improved the best ResNet18 full-image model to Macro-F1 = 0.838 (specificity = 0.881, sensitivity = 0.780).
- The best crop-only system was ConvNeXt-Tiny with light augmentation and dropout 0.0, reaching Macro-F1 = 0.812 — only 2.6 percentage points below the best full-image result.
- Freezing the backbone consistently decreased performance (+1.9pp drop), confirming that full fine-tuning is necessary for this task.
Training Curves
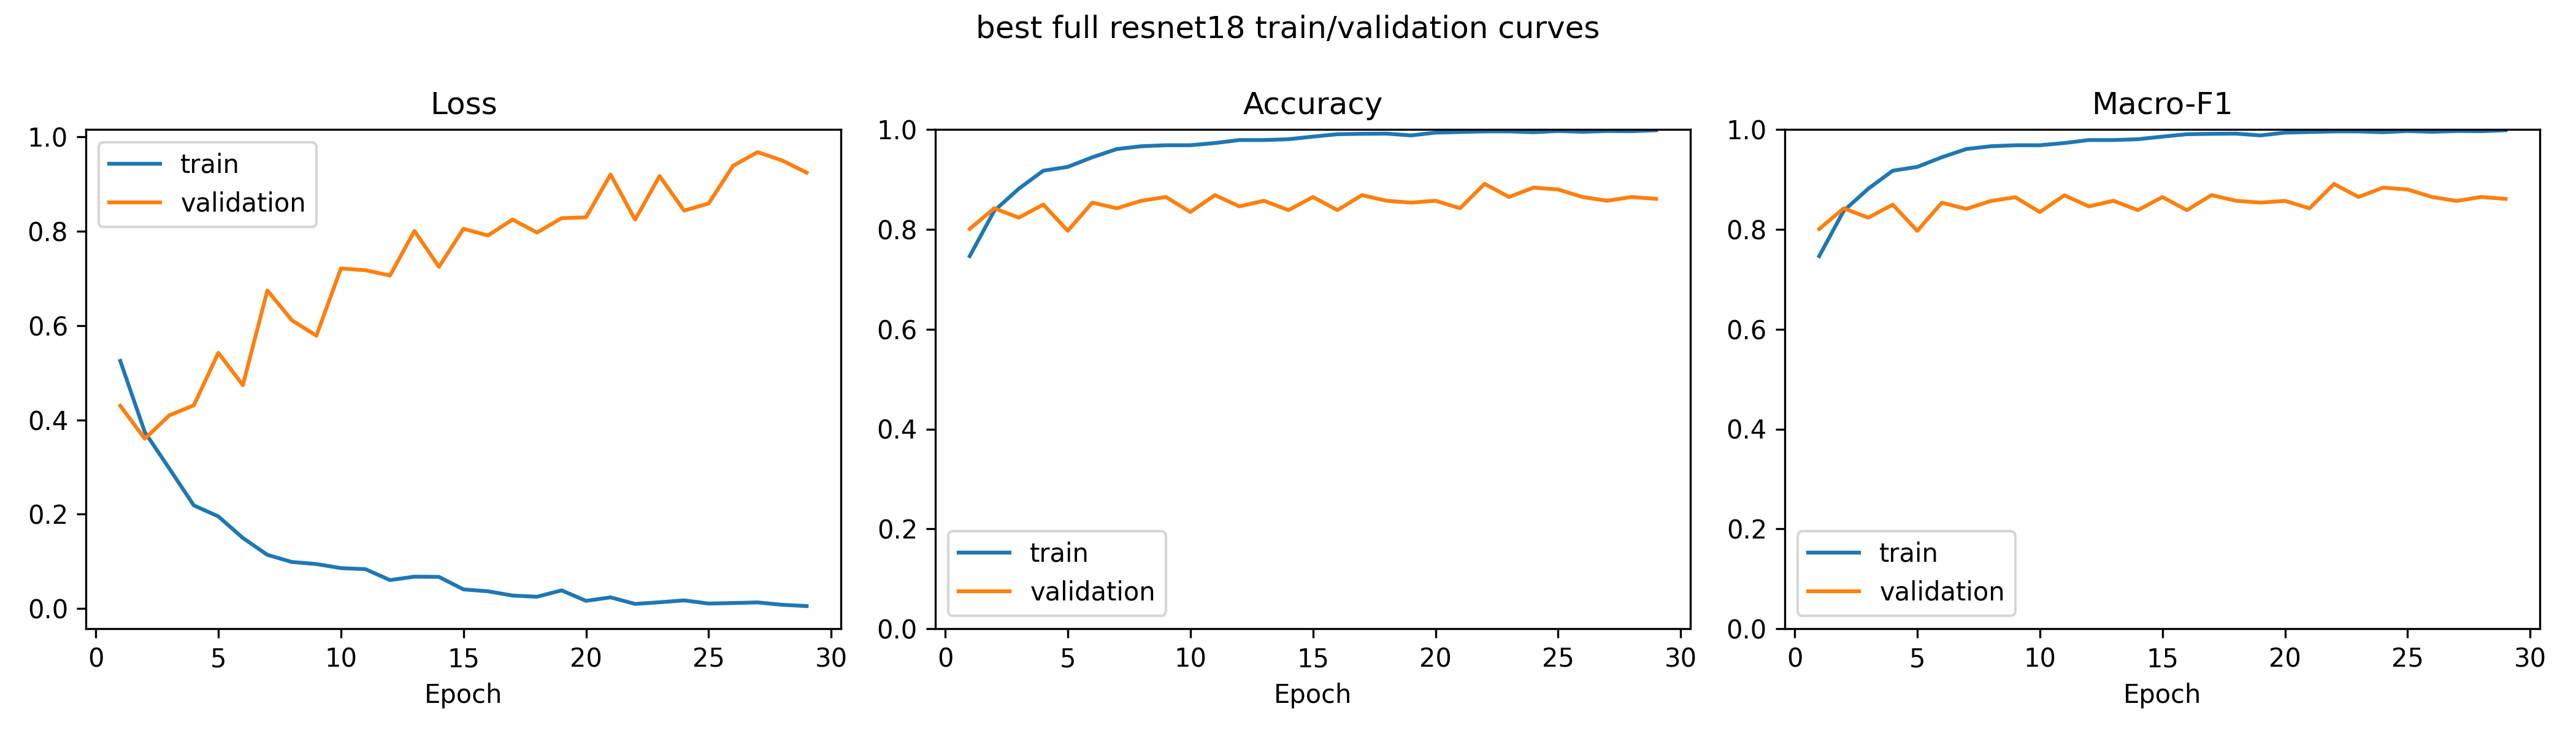
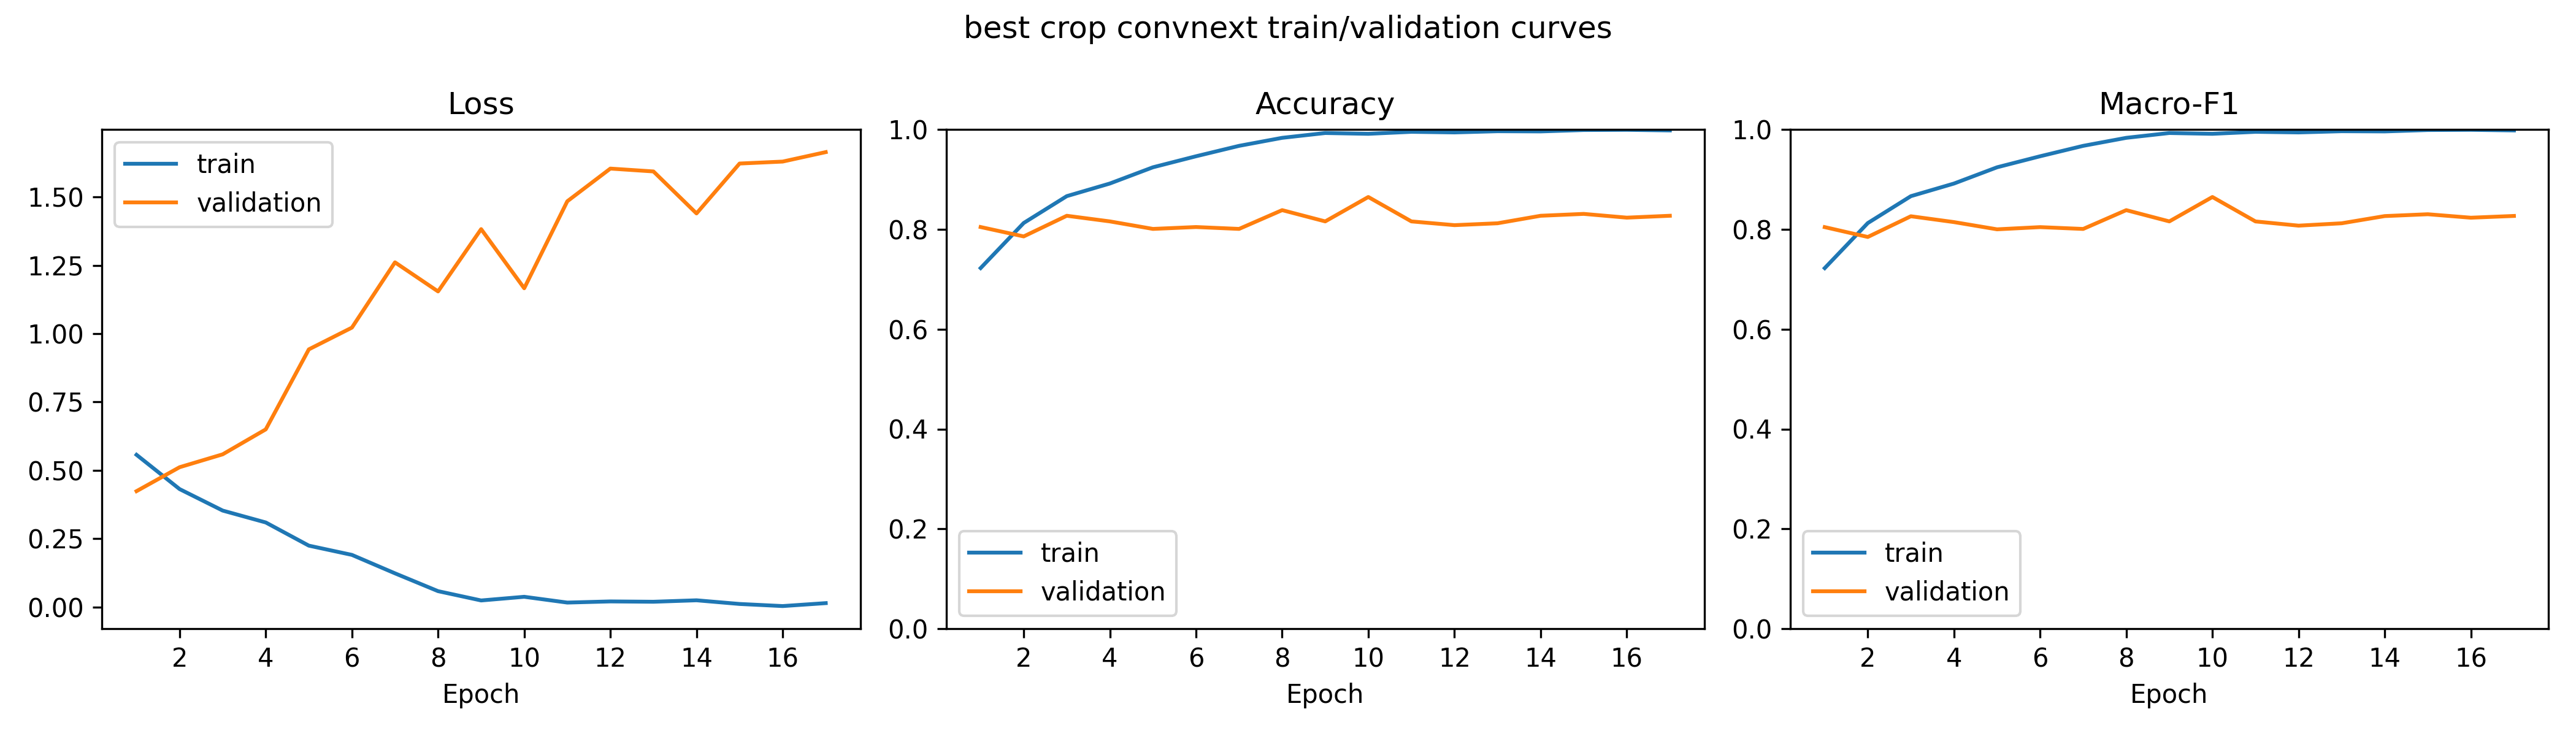
Training curves for the best full-image ResNet18 model show clear overfitting after the best validation checkpoint. Early stopping mitigates this by restoring the checkpoint with the highest validation Macro-F1 for testing.
Qualitative Analysis: Grad-CAM and Saliency Maps
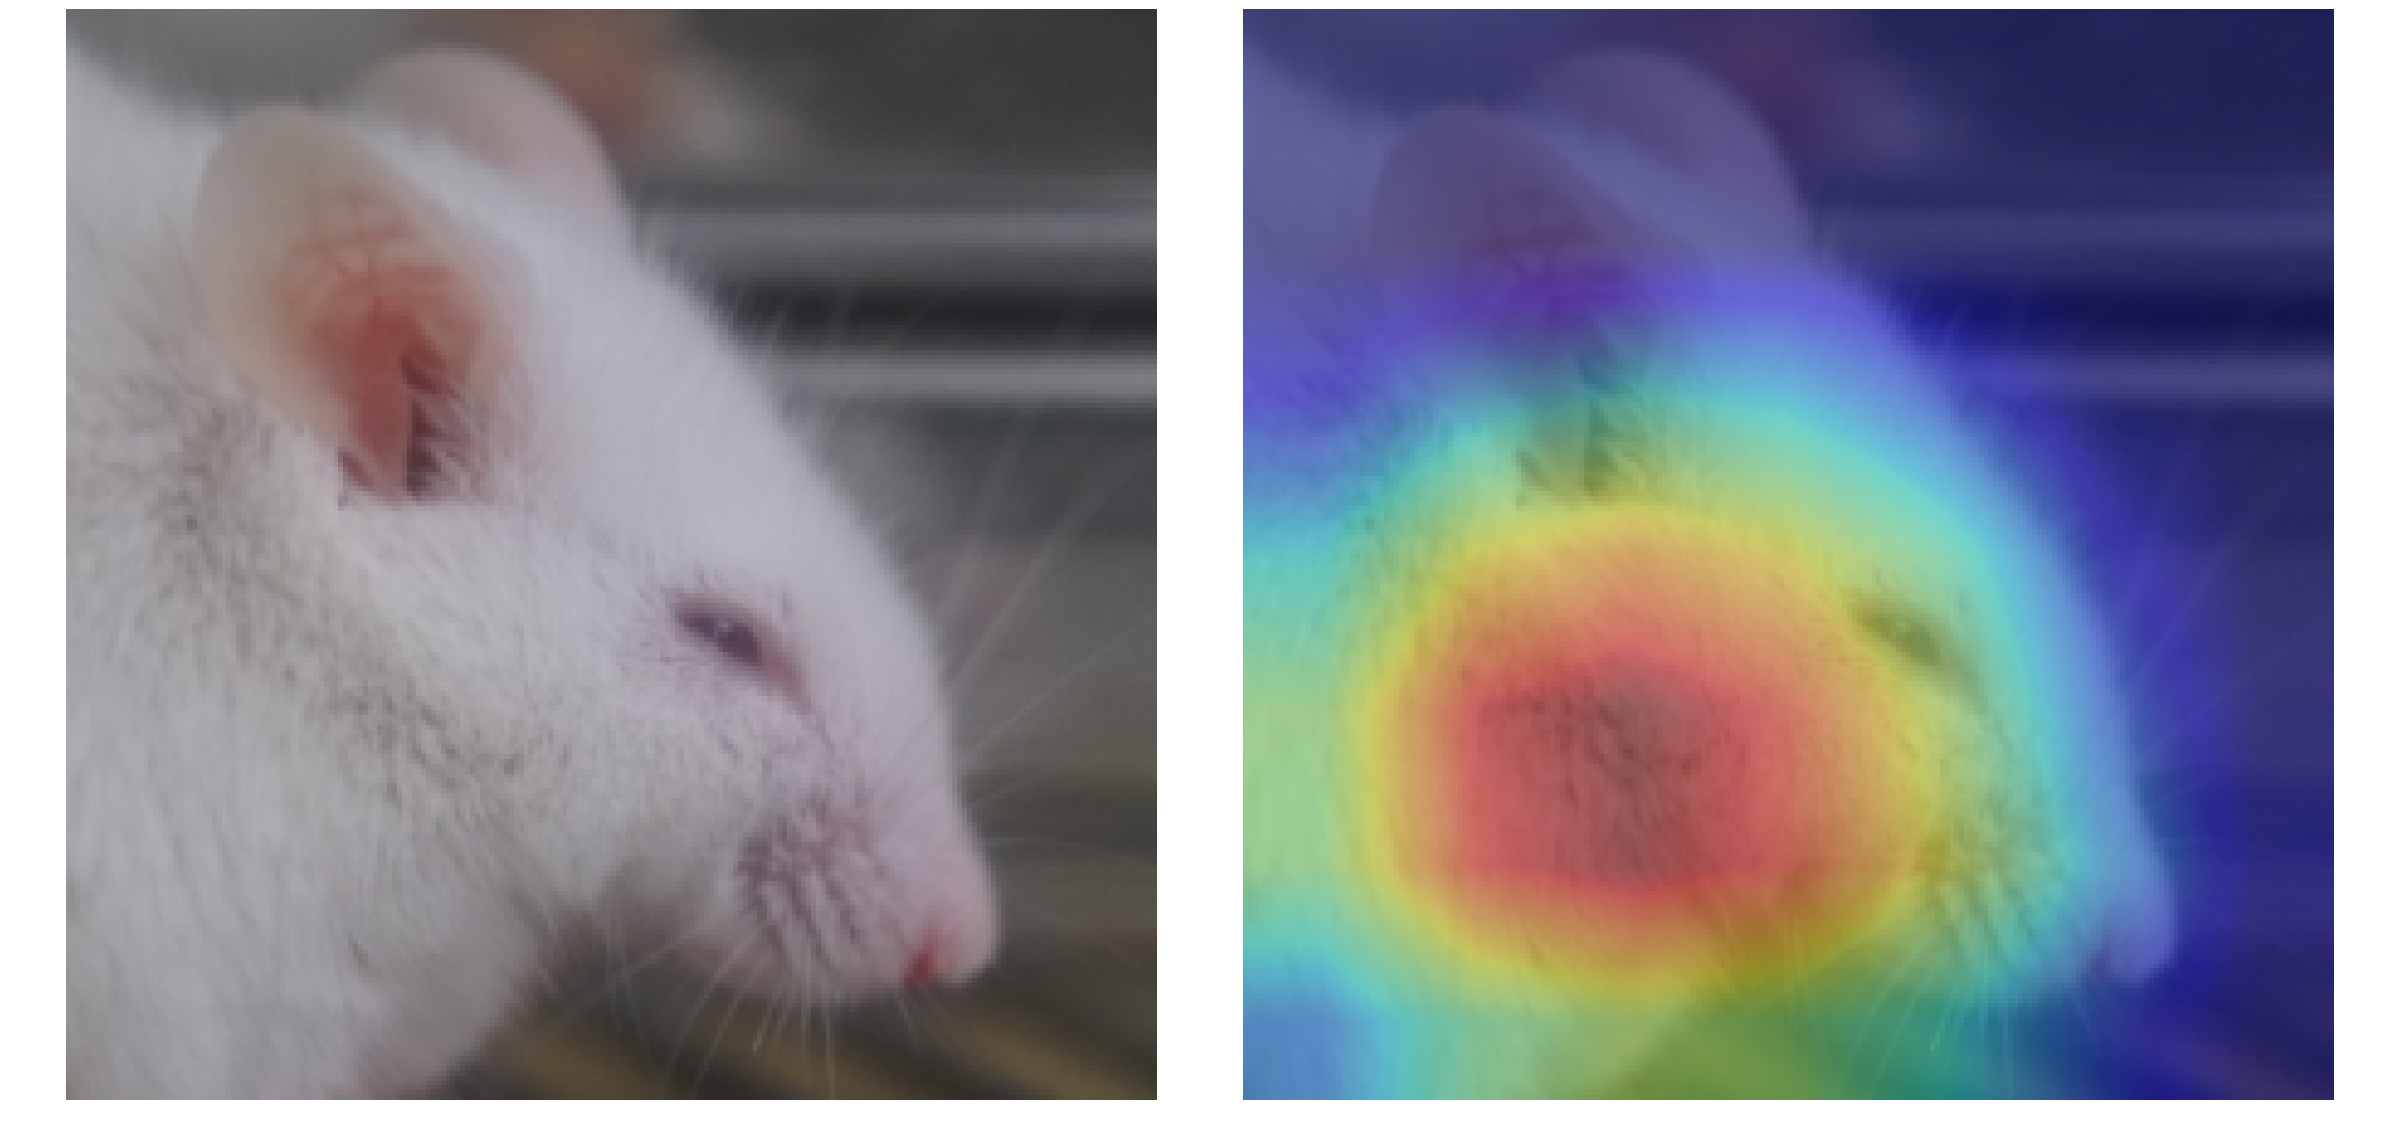
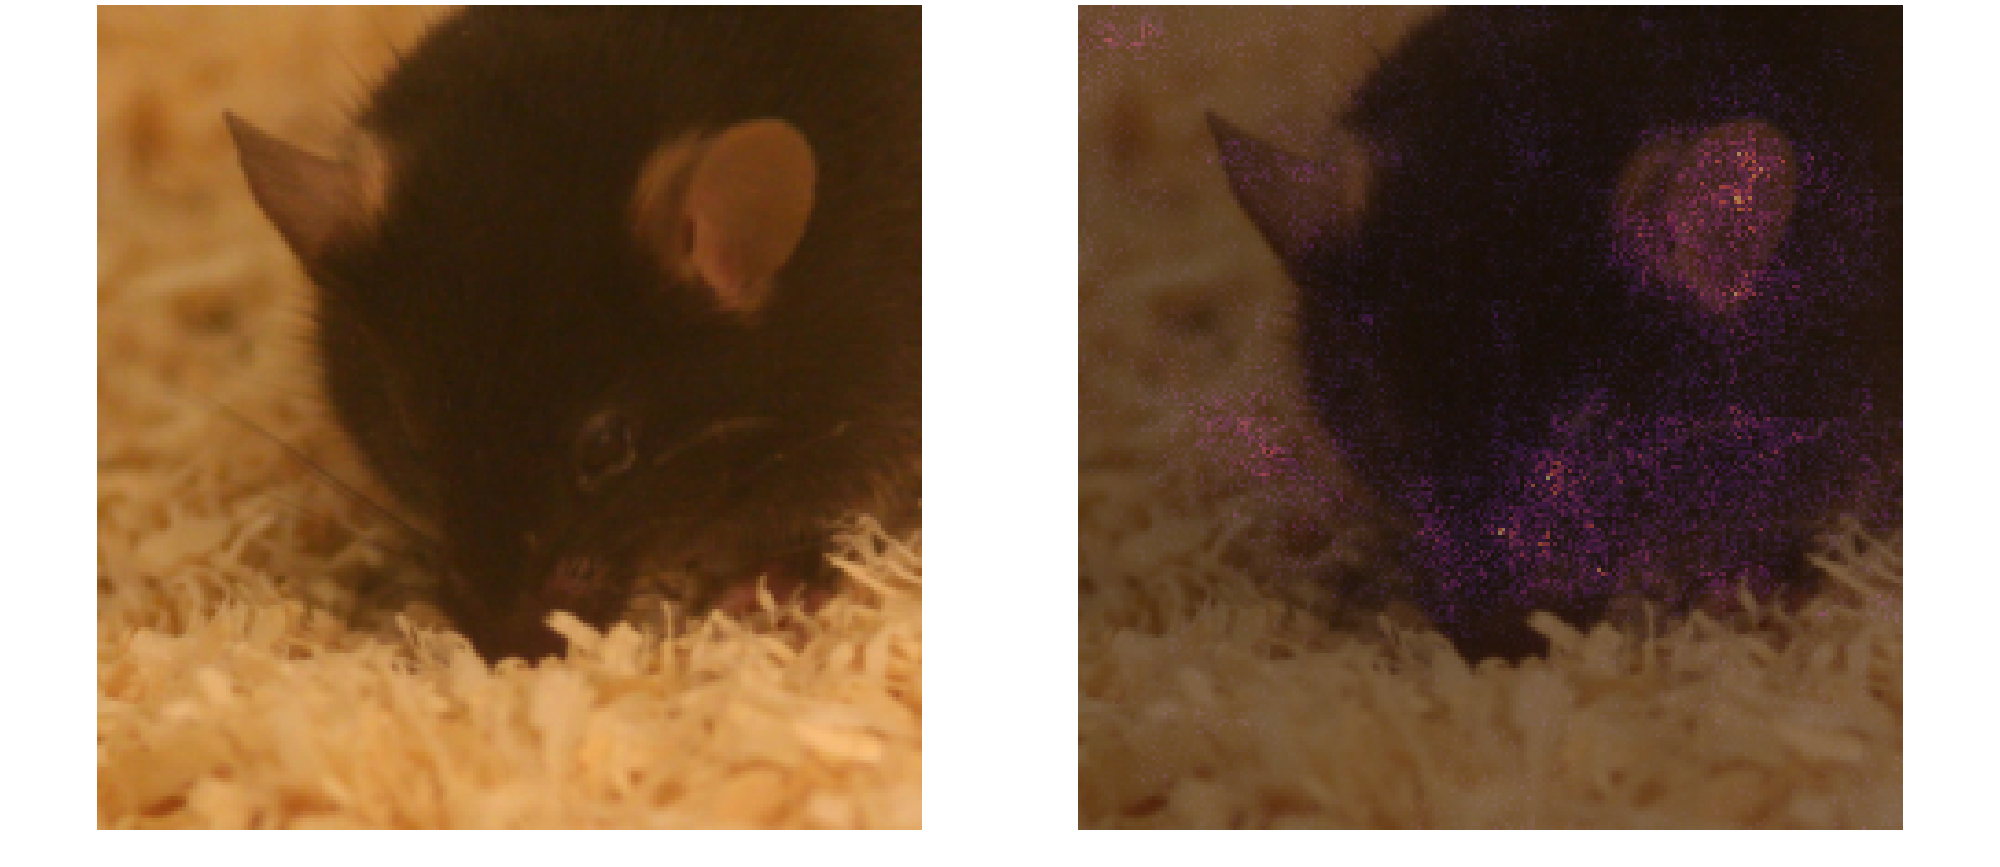
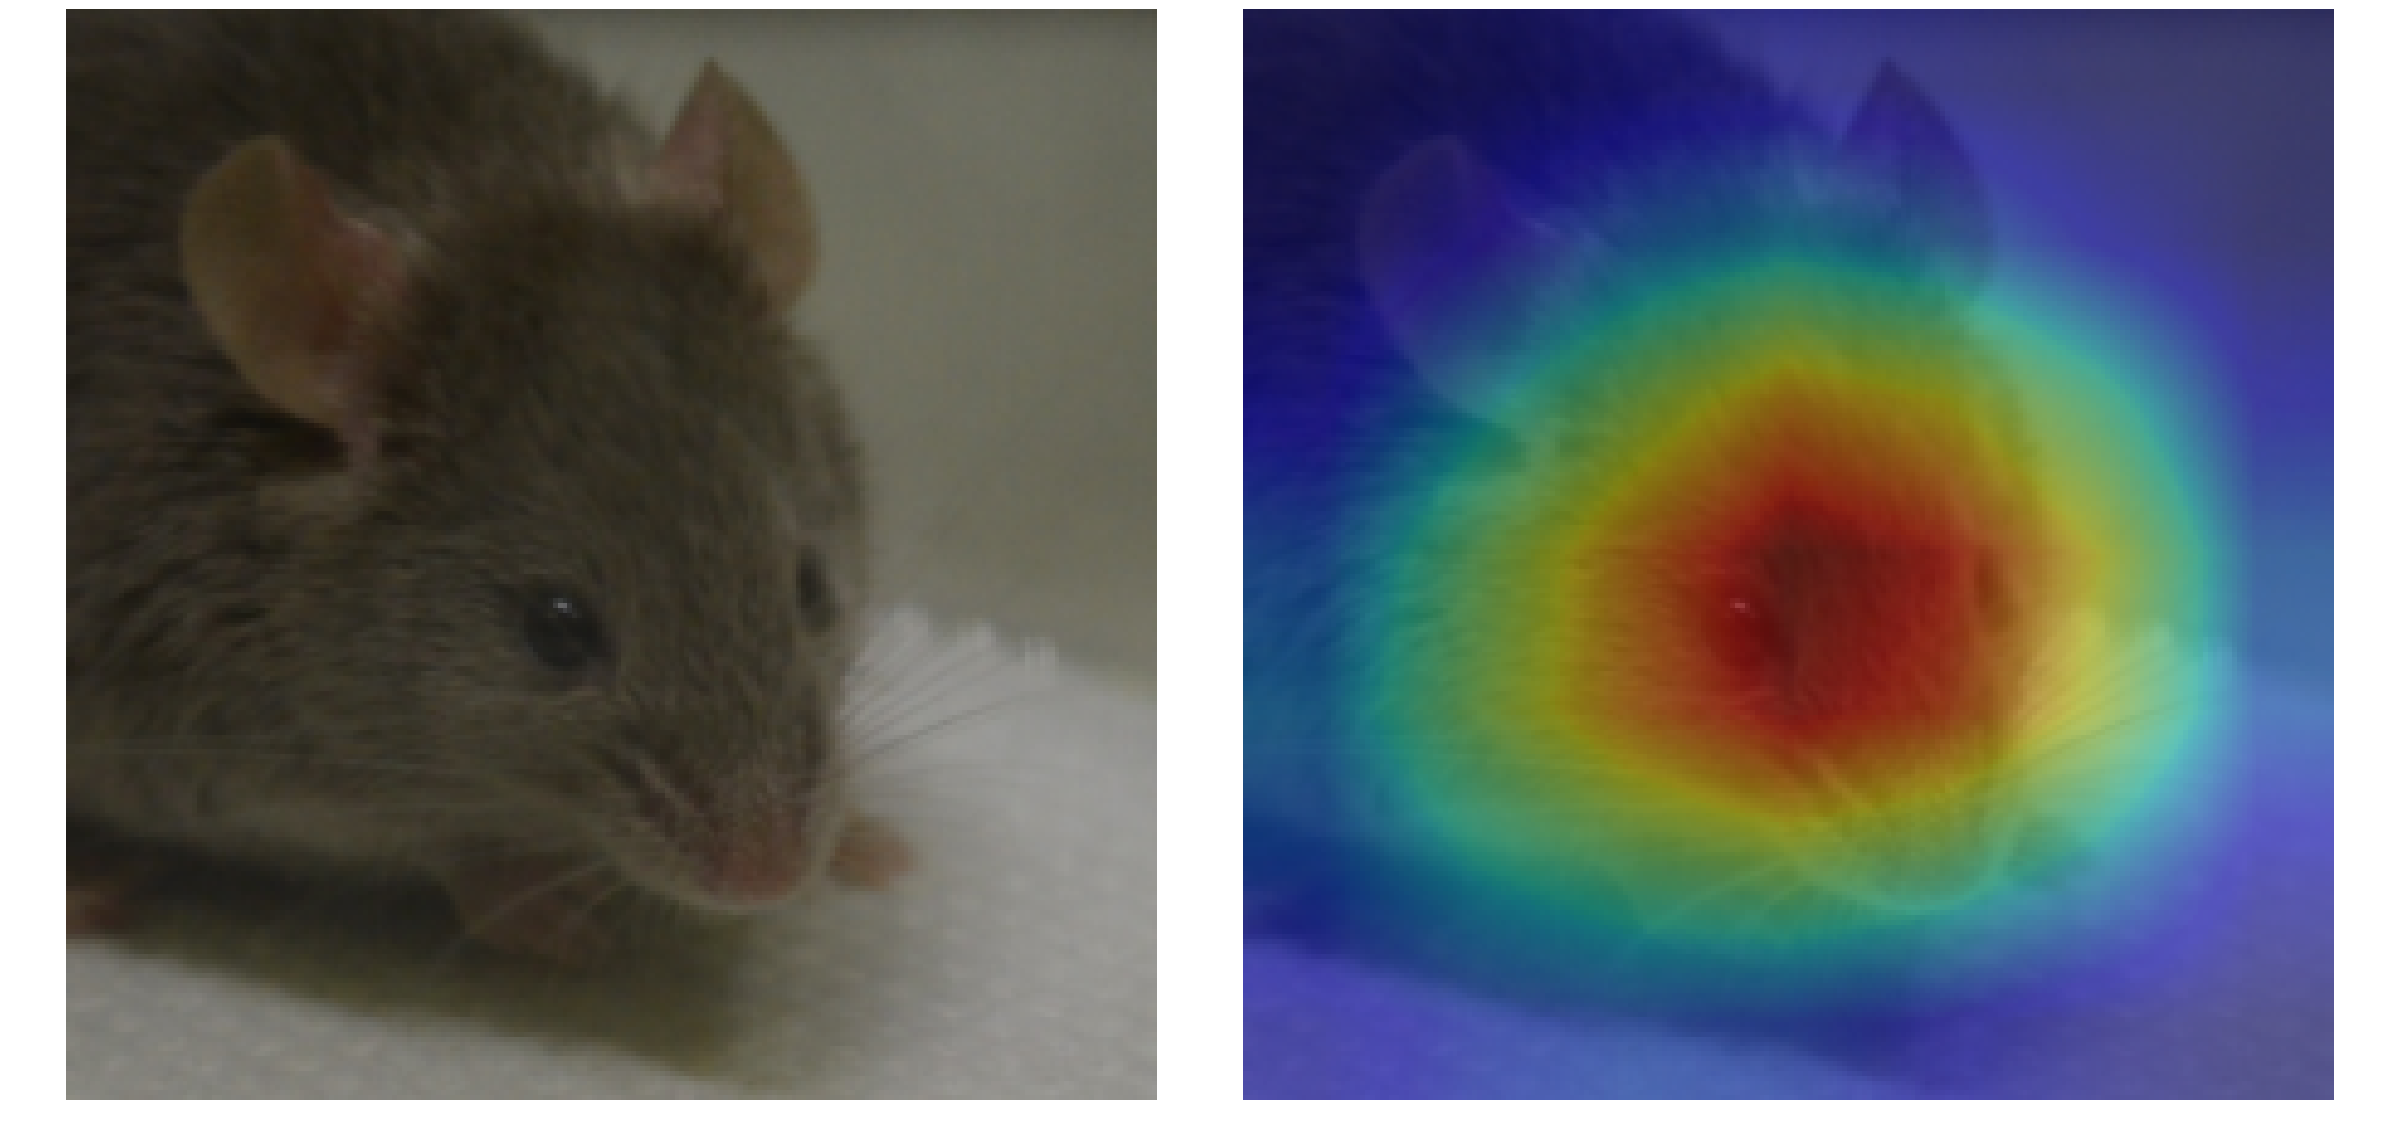
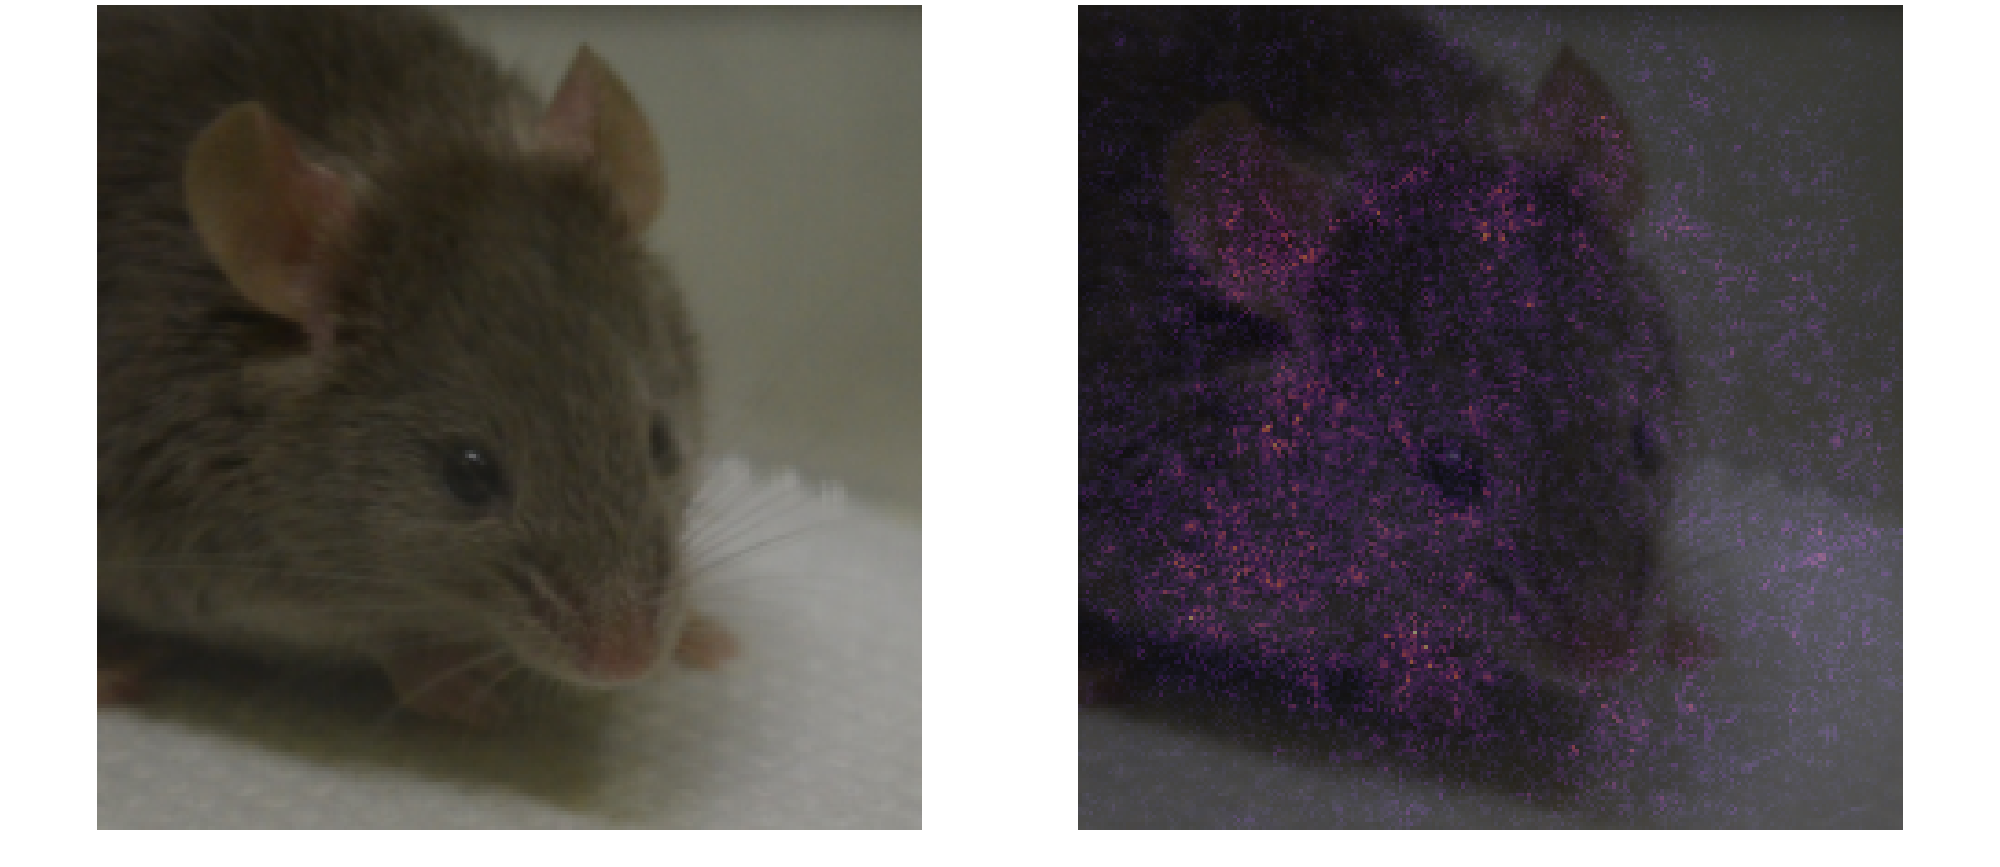
To understand which image regions the models rely on for their predictions, Gradient-weighted Class Activation Mapping (Grad-CAM) and saliency maps were generated. Grad-CAM produces a heatmap where warmer colors (red) represent areas with a stronger influence on the prediction and cooler colors (blue) indicate regions with little contribution.
Full-Face Model
For correctly classified impaired mice (true positives), the full-image ResNet18 model focuses attention primarily on the muzzle and eye region, consistent with the MGS facial action units that indicate pain or discomfort.
For misclassified samples (false negatives), the model's attention appears more diffuse or shifted toward background content, suggesting that the facial cues were ambiguous or insufficient.
Muzzle Crop Model
For the muzzle-crop ConvNeXt-Tiny model, Grad-CAM heatmaps show concentrated attention on the nose and whisker region, confirming that the model extracts meaningful features from the restricted input.
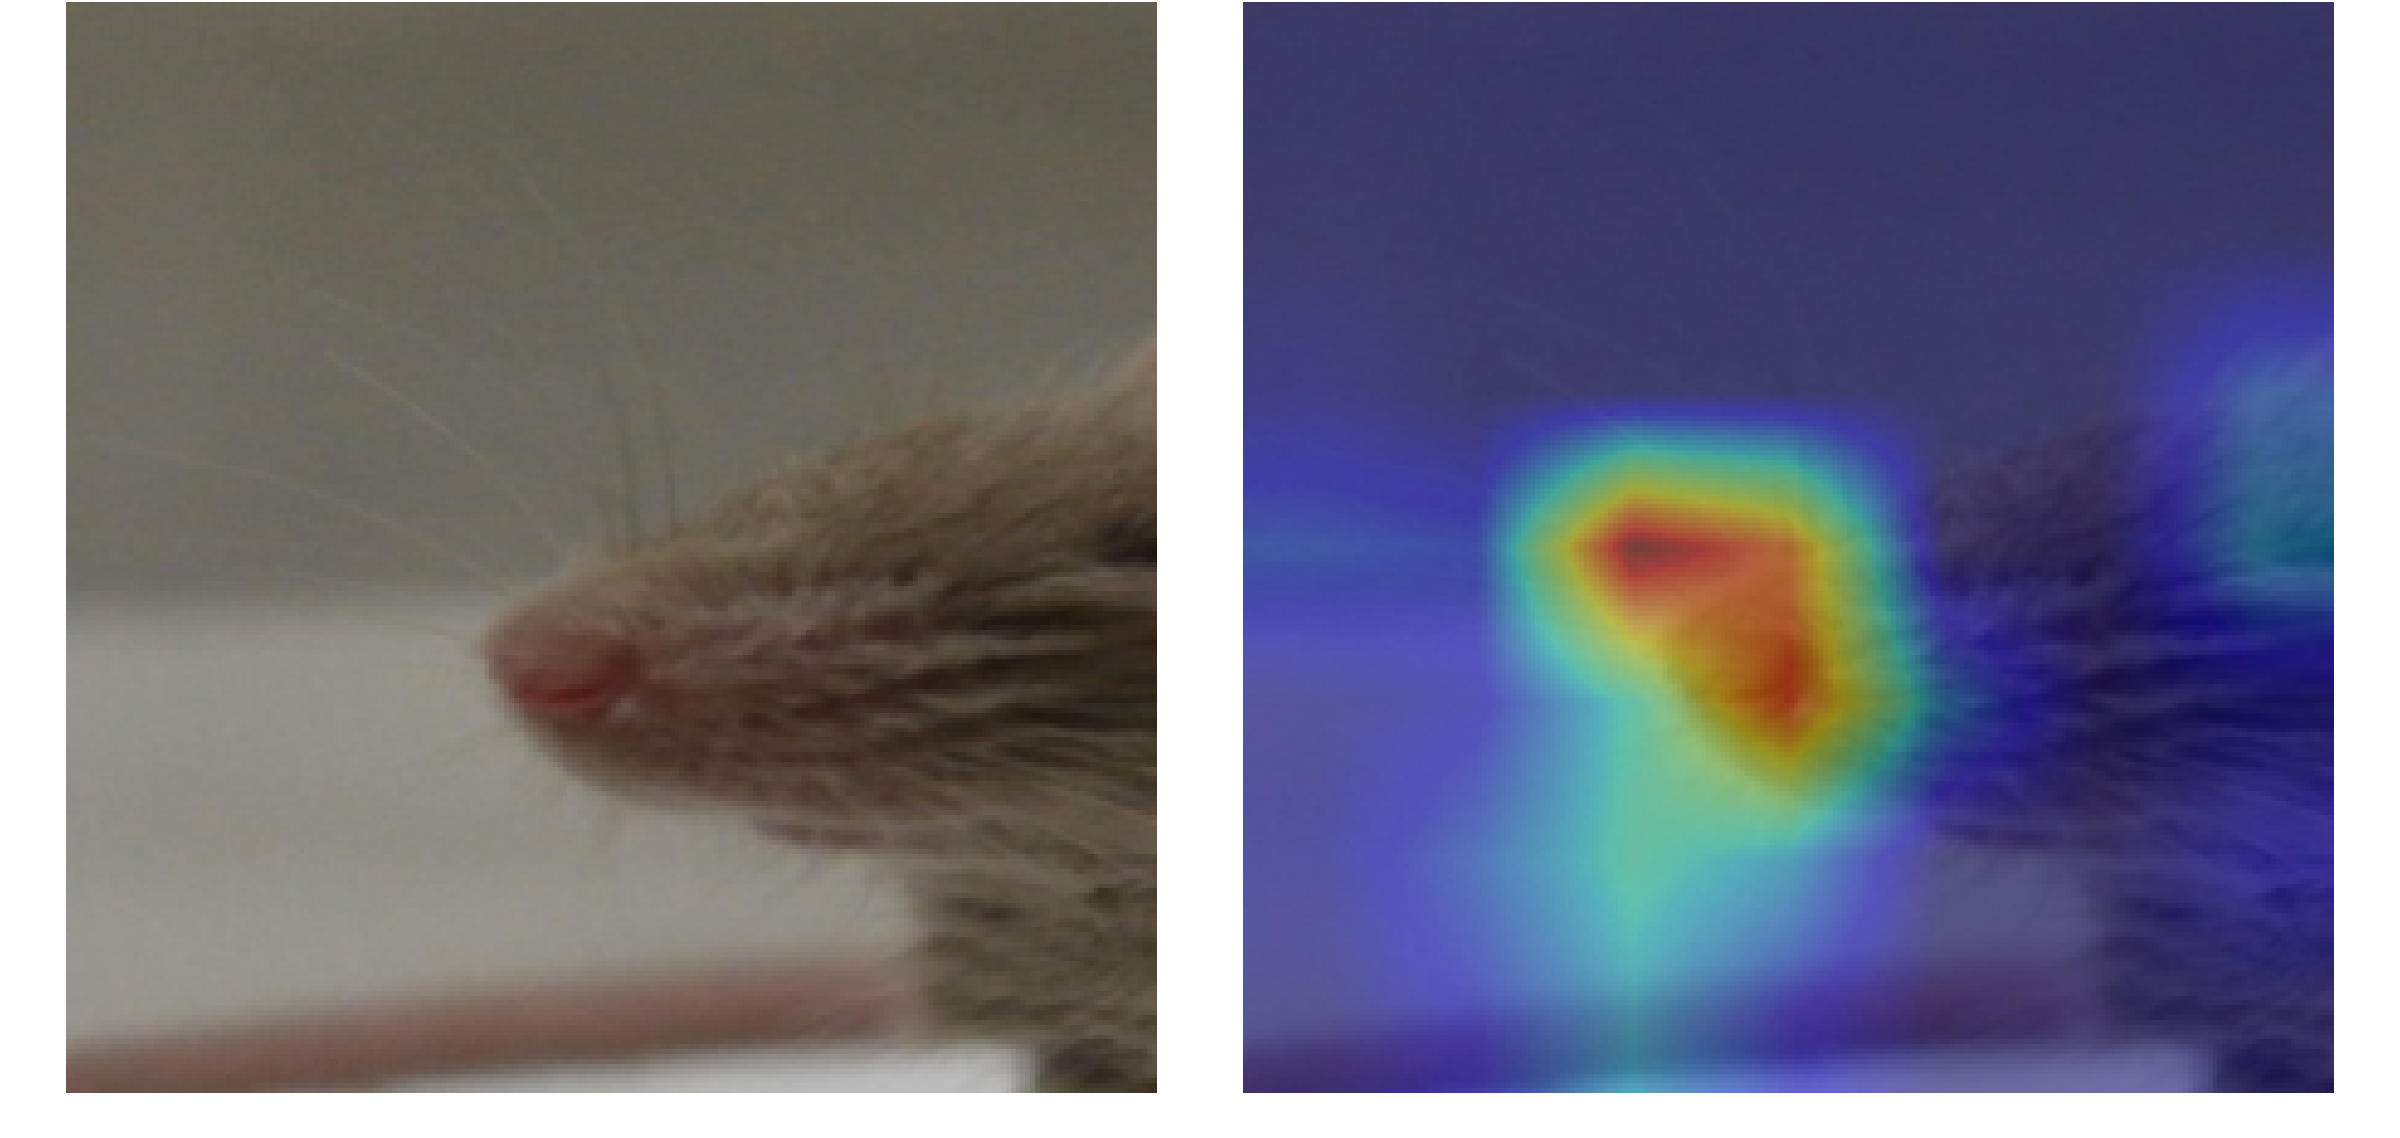
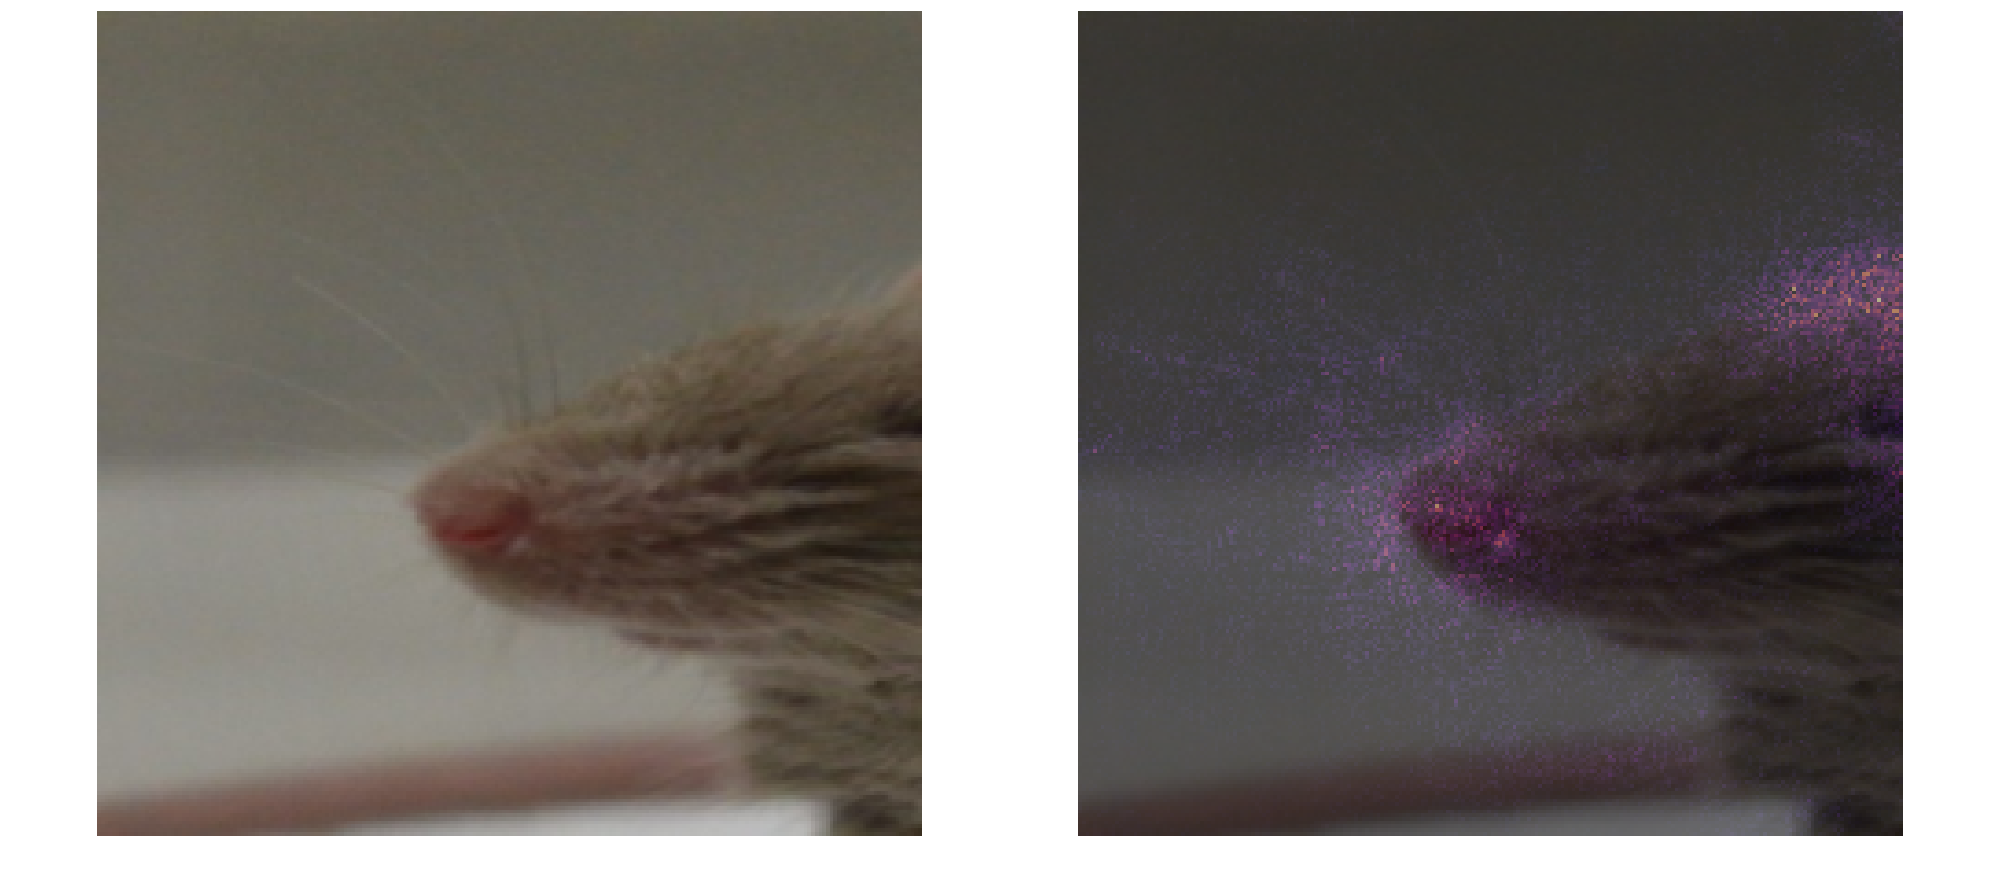
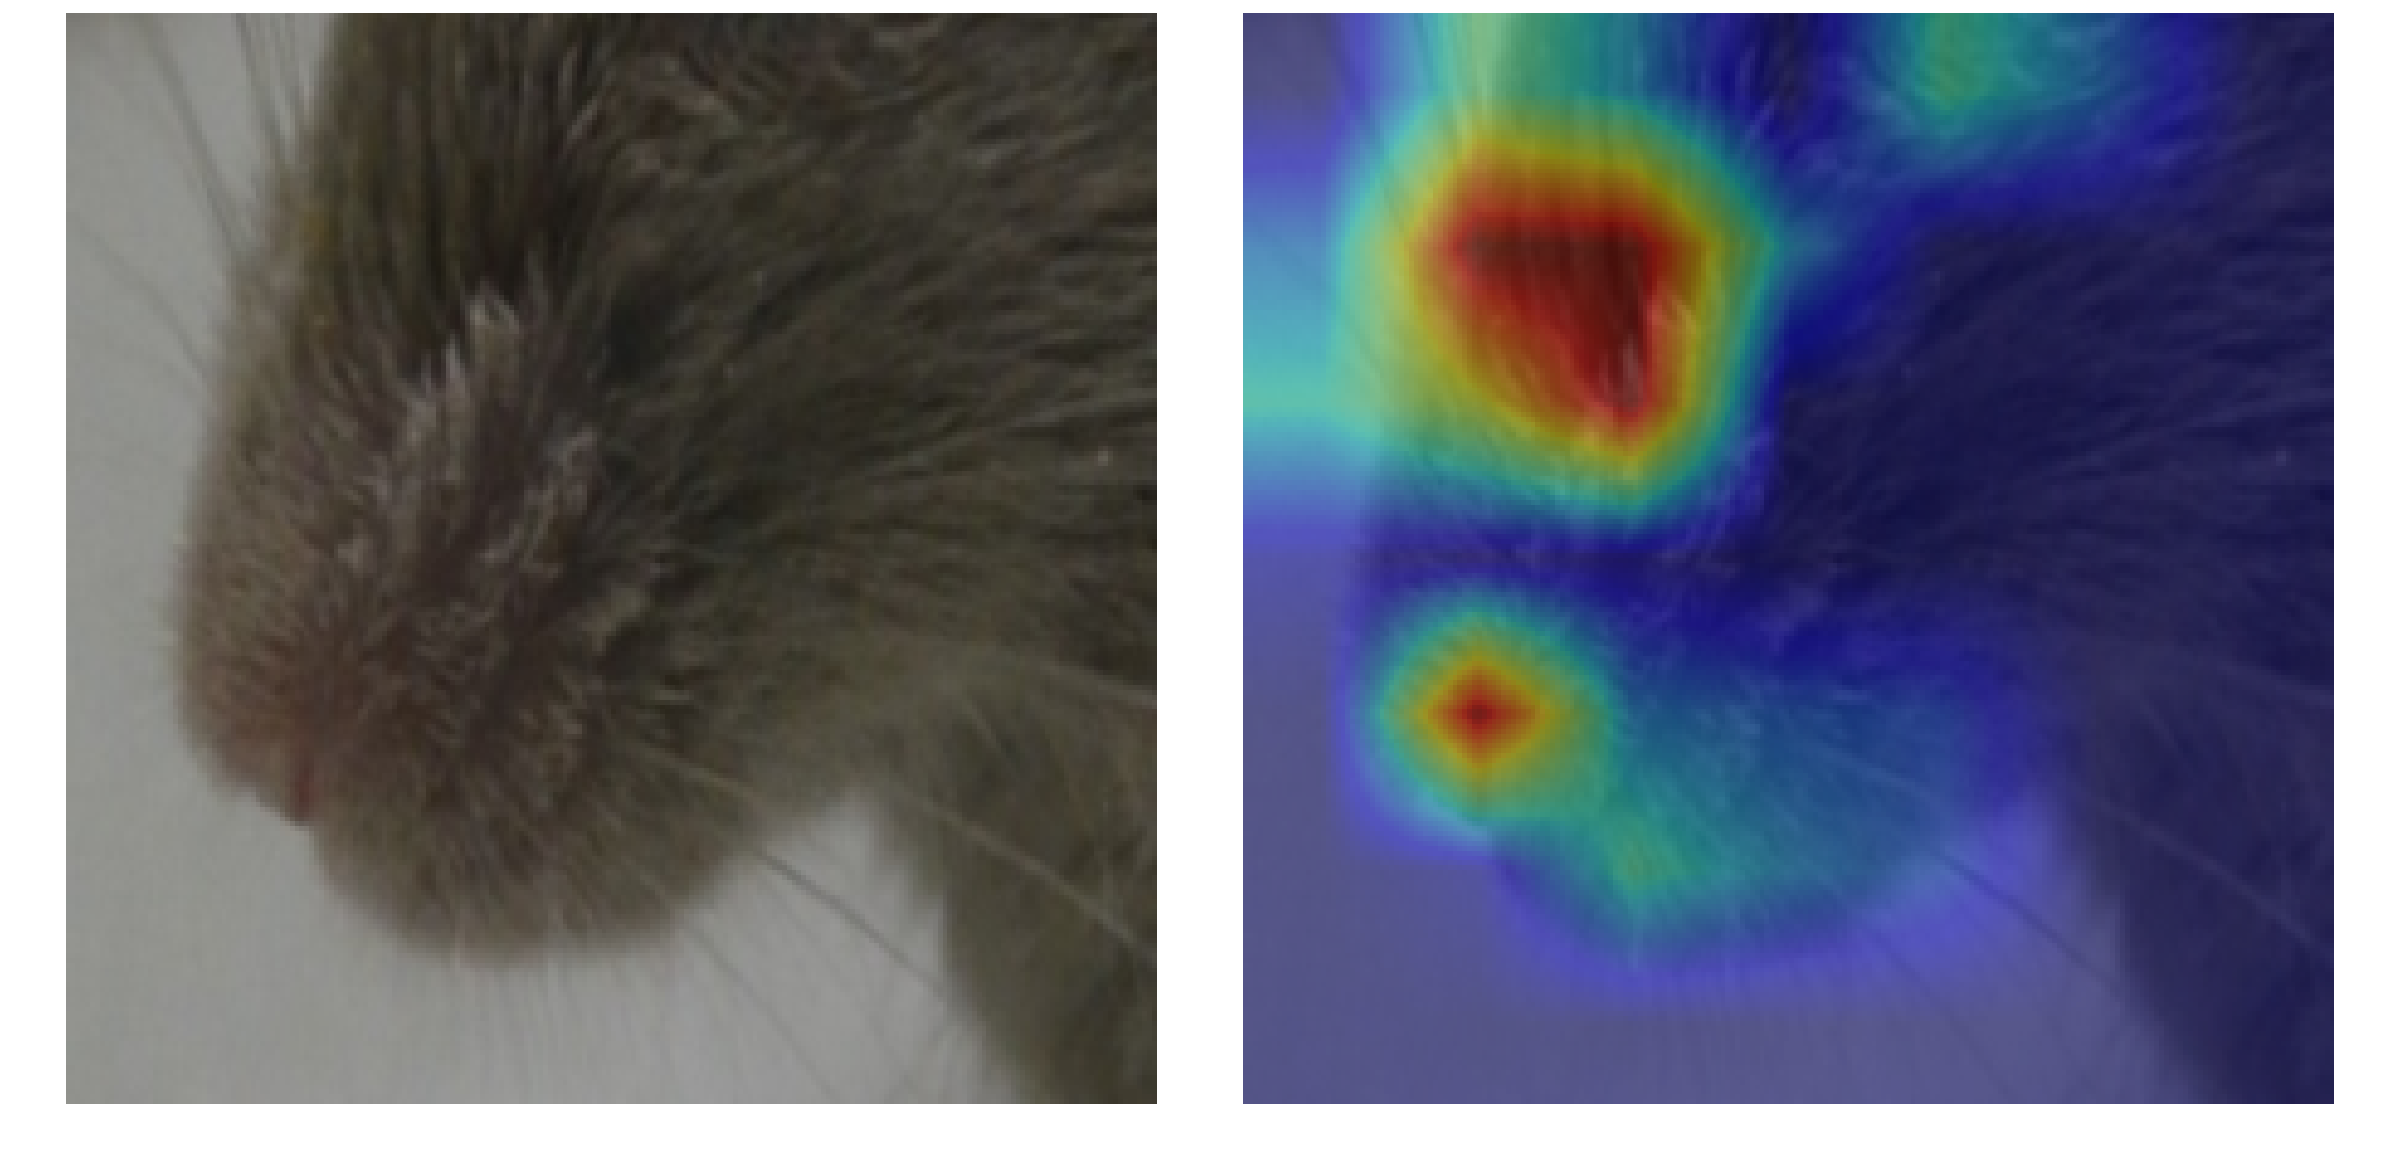
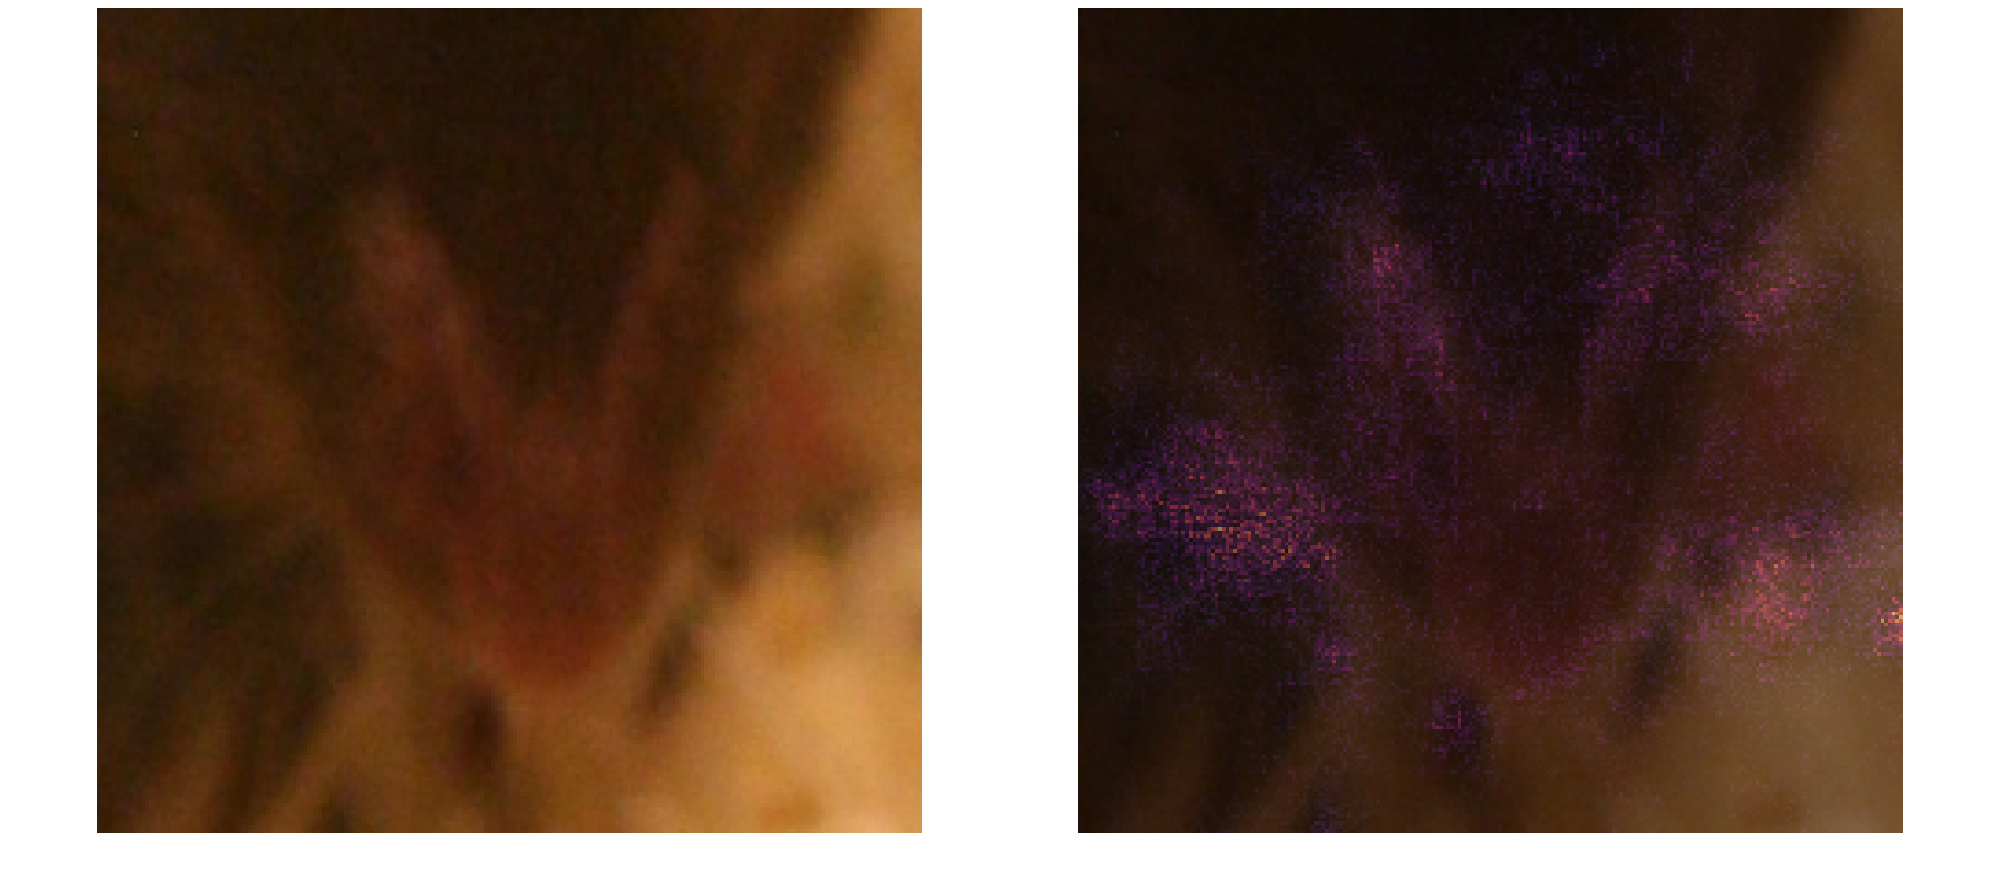
Although Grad-CAM and saliency maps cannot establish causal relationships between individual image features and model predictions, they provide useful qualitative evidence that the networks base their decisions on visually meaningful facial characteristics. These observations are consistent with the quantitative results and further support the feasibility of automatic mouse well-being classification using facial images, including muzzle-only representations.
Discussion
The muzzle contains substantial information
The central objective of this work was to investigate whether mouse well-being can be assessed using muzzle images alone. Although the highest overall performance was achieved using full-face images, the best crop-based model reached a Macro-F1 score of 0.812, only 2.6 percentage points below the best full-image result. This relatively small performance gap indicates that restricting the input to the muzzle preserves much of the visual information required for binary well-being classification.
Training strategy matters as much as architecture
The ablation experiments demonstrated that training strategy has a substantial influence on model performance. Light data augmentation produces clear improvements for ResNet18 (+5.7pp), whereas ConvNeXt-Tiny is comparatively insensitive. Reducing the learning rate further improved the best ResNet18 model, while freezing the backbone consistently decreased performance. These observations indicate that careful optimization of training hyperparameters is essential when adapting ImageNet-pretrained models to relatively small biomedical image datasets.
Generalization remains data-dependent
Performance varied considerably across experimental subsets, with Macro-F1 ranging from 0.575 to 0.882. While some of this variation can be explained by differences in subset size, the lower performance observed on certain subsets despite large test set sizes suggests that factors beyond sample size — such as imaging conditions, experimental protocols, or mouse appearance — influence generalization.
Limitations
- The curated dataset contains 1,778 annotated images, representing only a subset of the available ~35,000 recordings.
- Binary labels are derived from manual MGS scores, meaning inter-rater variability introduces unavoidable label noise.
- All experiments use a single train/validation/test split; reported performance does not capture variability across different random partitions.
- Manually prepared muzzle crops reduce scalability and motivate future development of automatic localization methods.
Conclusion
We presented a reproducible deep-learning study of binary mouse well-being classification from images. Using MGS-derived labels and a fixed subset/class-stratified split, we compared ResNet18 and ConvNeXt-Tiny on muzzle crops and full images across 14 experimental configurations.
The best overall system was full-image ResNet18 with light augmentation and learning rate 5×10⁻⁵ (Macro-F1 = 0.838, specificity = 0.881, sensitivity = 0.780). The best crop-only system was ConvNeXt-Tiny with light augmentation and dropout 0.0 (Macro-F1 = 0.812).
Together, these findings support the feasibility of predicting MGS-derived binary impairment labels from mouse facial imagery, including muzzle-only crops, and provide a reproducible experimental baseline for future work on automated, non-invasive welfare assessment.
Technical Stack
- Python
- PyTorch
- ResNet18 (ImageNet-pretrained)
- ConvNeXt-Tiny (ImageNet-pretrained)
- Grad-CAM (model interpretation)
- Saliency Maps
- AdamW Optimizer
- Early Stopping / ReduceLROnPlateau