Coating Robots
This work was carried out as part of the 3D-ProSim project at GFaI (Gesellschaft zur Förderung angewandter Informatik e.V.) in Berlin. The project simulates robotic coating processes in 3D for sanitary ware manufacturing.
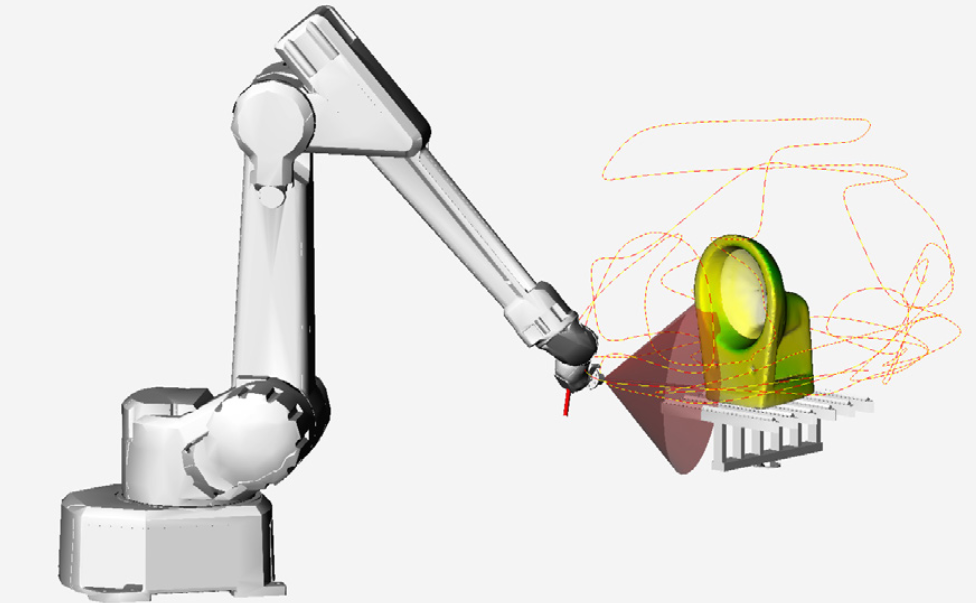
In these applications, a coating robot follows predefined trajectories around the target object. Each trajectory consists of selected positions, angles, and duration times. The robot moves around the object and stops at each position to spray ceramic glaze material.
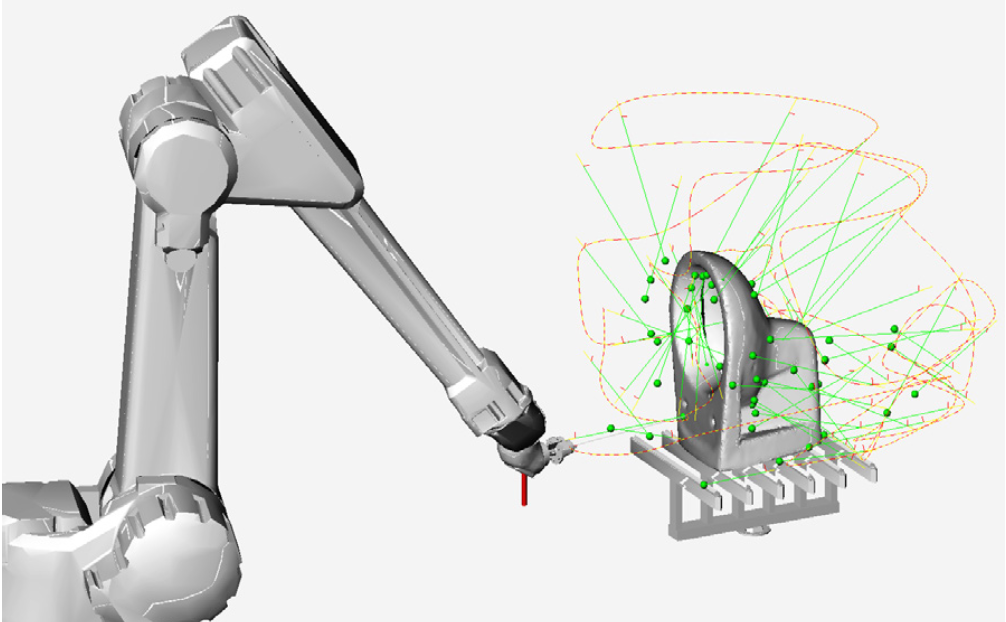
At each position along the trajectory, the robot activates its spray nozzle and deposits ceramic glaze onto the object surface.
What is Overspray
Not all of the ceramic glaze material reaches the intended surface. The portion that misses the target object — landing on adjacent surfaces, the floor, or dissipating into the air — is called overspray.
Overspray is a significant cost factor. The ceramic glaze material used in these applications is expensive; the oversprayed gram amount is comparable to gold dust in terms of cost per unit. Reducing overspray directly translates to economic savings and reduced environmental waste.
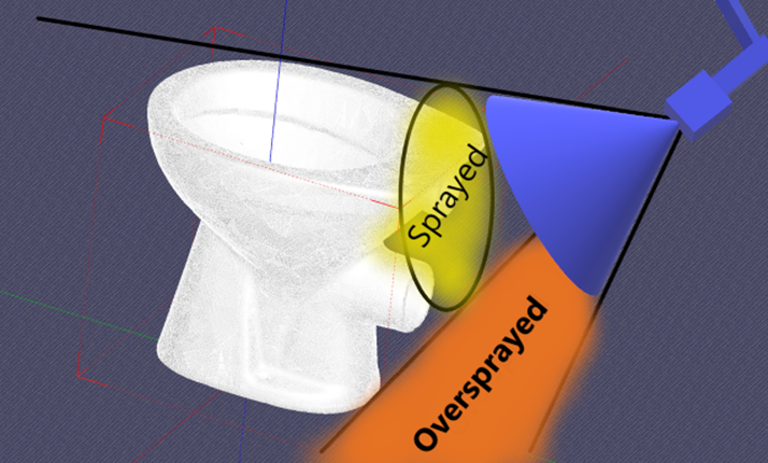
Given a 3D model of a sanitary ware object and a simulated spray cone trajectory, calculate the exact amount of overspray — the coating volume that misses the target surface.
Approach
To determine where the glaze material can actually hit the target object, a multi-stage culling pipeline was applied. The spray cone itself is not directly represented as a point cloud. Instead, the goal is to identify which parts of the target surface are reachable by the spray cone at each position:
- Delaunay Triangulation: The target object is represented as a point cloud and reconstructed into a triangular mesh using the 3D Delaunay triangulation method. This provides a structured surface representation with well-defined triangles.
- Back-face Culling: Triangles on the target mesh whose normals face away from the spray nozzle are discarded. These surfaces cannot receive any coating material from the current nozzle position.
- Frustum Culling: Triangles that fall outside the spray cone frustum are eliminated. Only surfaces within the cone's angular reach are retained.
- Occlusion Culling: Triangles that are occluded — hidden behind other surfaces from the nozzle's viewpoint — are removed. This ensures that only truly reachable surfaces remain.
After these culling operations, the remaining triangles represent the surfaces where the glaze material can potentially land. The next step is to determine the exact 3D shape of the glaze deposit on the object.
Alpha Shape Algorithm
To find the exact 3D shape of the glaze deposit on the target surface, the Alpha Shape algorithm and the Möller-Trumbore ray-triangle intersection algorithm are used together.
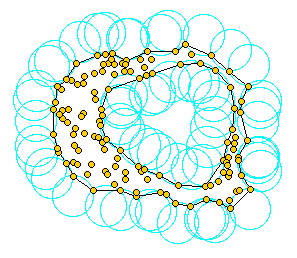
Points are generated along the base ellipse of the spray pattern, and rays are projected from the nozzle toward these points. Using the Möller-Trumbore algorithm, each ray is tested for intersection with the triangular mesh. Rays that intersect a triangle produce intersecting points (glaze lands on the object). Rays that miss all triangles produce non-intersecting points (overspray).
The Alpha Shape algorithm then constructs a concave boundary polygon around both the intersecting and non-intersecting point sets. Unlike a convex hull, the alpha shape captures concavities, holes, and irregular geometries — which is critical for the complex shapes of sanitary ware objects. The alpha parameter (α) controls how tightly the boundary wraps around the points.
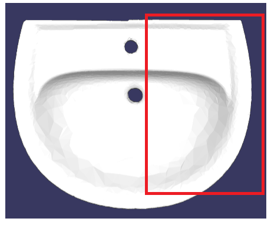
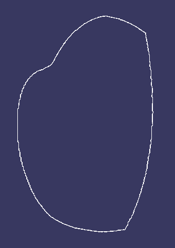

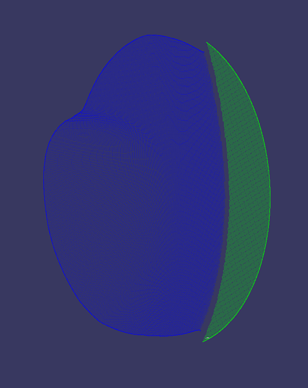
By identifying which triangles on the mesh fall inside the alpha shape of the intersecting points, the exact coated region is determined with high precision. The alpha shape of the non-intersecting points defines the overspray region.
Distribution Function
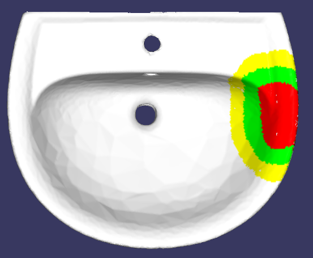
After determining the exact shape of the coated and oversprayed areas, the next step is to calculate how the glaze material is distributed across these regions. The distribution is not uniform — the nozzle concentrates more material near the center of the spray pattern, with decreasing density toward the edges.
A 3D distribution function was developed to account for this. The function considers both the distance from each point to the spray gun position and the distance from each point to the center of the ellipse representing the target surface. These distances are weighted (30% gun distance, 70% ellipse center distance) and can be adjusted based on real-world test data. The distribution values of the points are linked to their corresponding triangles using barycentric coordinates, enabling the estimation of approximate gram values per triangle.
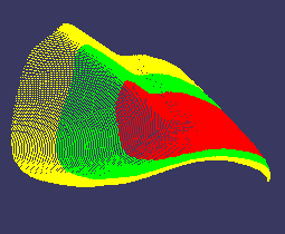
Thickness Visualization
After calculating the distributed gram values, the thickness of the glazed surface was computed and visualized using a color transition: yellow for thin coating, green for the intended (target) thickness, red for excessive coating, and black for the thickest areas. Green represents the correct amount of glaze, making it easy to identify areas that are under-coated or over-coated at a glance.
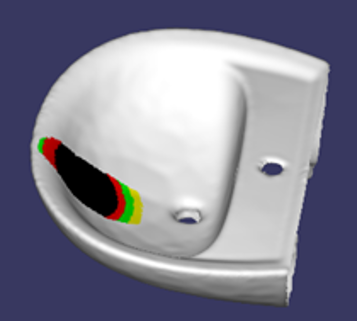
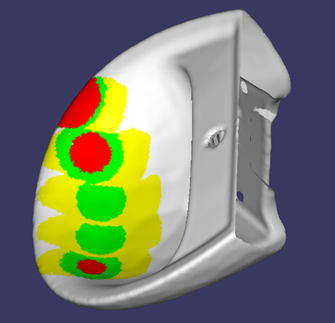
3D-NordOst Workshop & Publication
I presented this work at the 3D-NordOst workshop in Berlin, an annual event organized by GFaI in Berlin-Adlershof focused on the practical application, acquisition, modeling, and processing of 3D data. The presentation was 30 minutes long and covered the overspray problem, the computational geometry approach (culling pipeline, Alpha Shape, Möller-Trumbore), the distribution function, and results.
Research Publication
Authored the technical paper "Alpha Shape for 3D Point Cloud Analysis" (ISBN: 978-3-942709-34-7), published in the GFaI-Tagungsband 2024.
Authors: Burak Hafizoglu, Leonardo Maben, Stephan Brodkorb, Benjamin Hohnhäuser
View the 3D-ProSim project page at GFaI
Technical Stack
- C++
- Alpha Shape Algorithm
- Möller-Trumbore Ray-Triangle Intersection
- 3D Delaunay Triangulation
- Back-face / Frustum / Occlusion Culling
- 3D Point Cloud Processing
- Google Test (unit testing)
- 3D-ProSim Platform (GFaI)